> ## Documentation Index
> Fetch the complete documentation index at: https://docs.sevalla.com/llms.txt
> Use this file to discover all available pages before exploring further.
# Applications - Analytics
> View detailed analytics for your applications, including usage and performance insights.
Sevalla charges for [Application Hosting](https://sevalla.com/application-hosting/) based on bandwidth, build time, and application hosting pod usage. With Application Analytics, you can get insights into your application's usage data. For more information about how we calculate your invoice, refer to [Application Pricing](/billing/application-pricing).
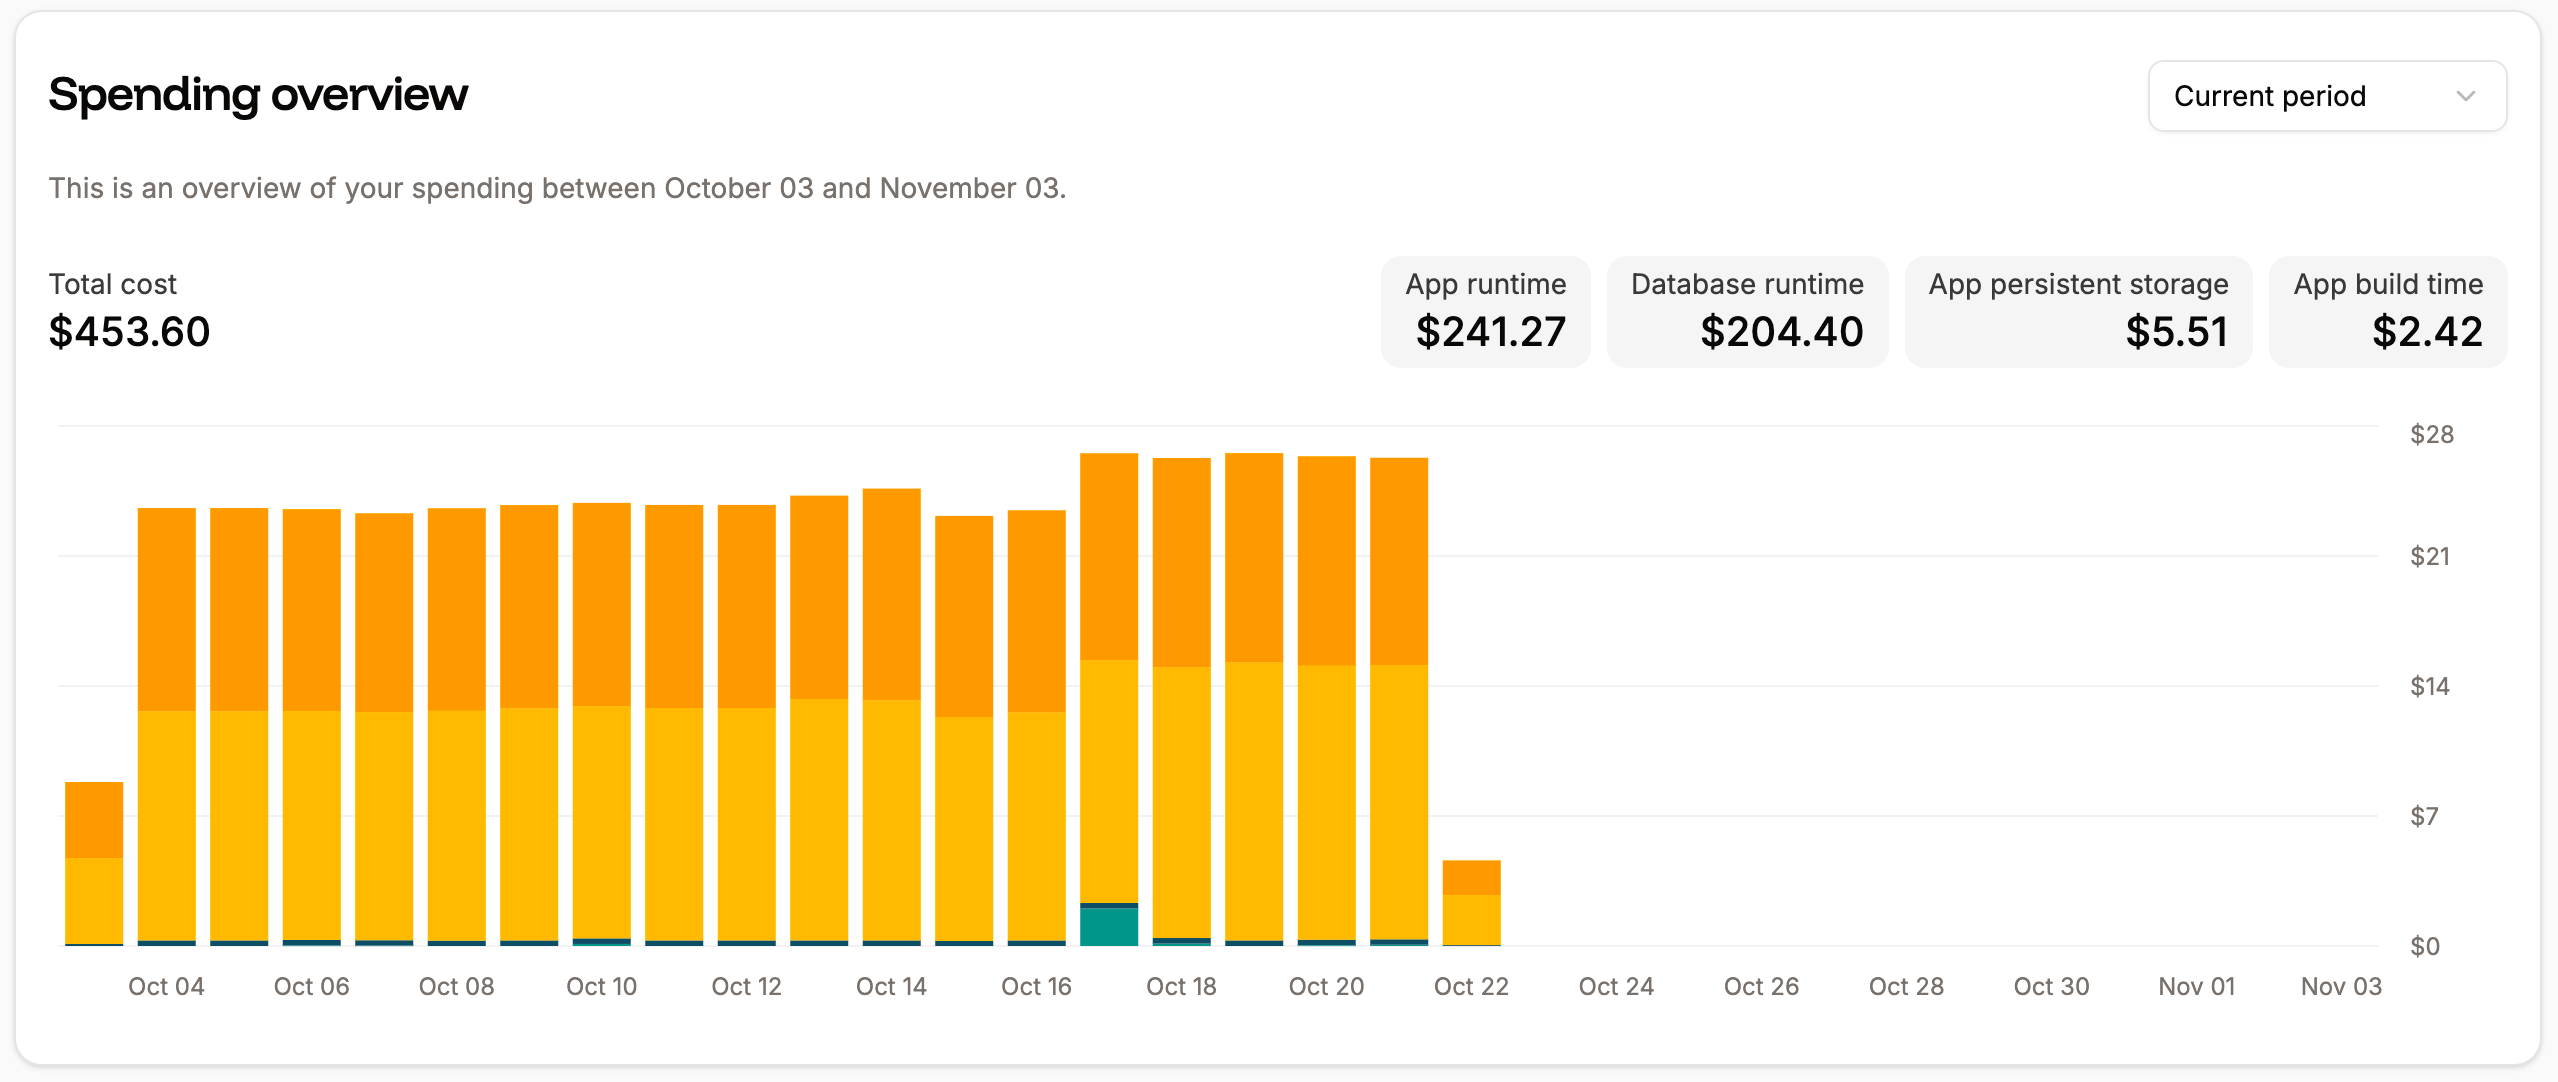
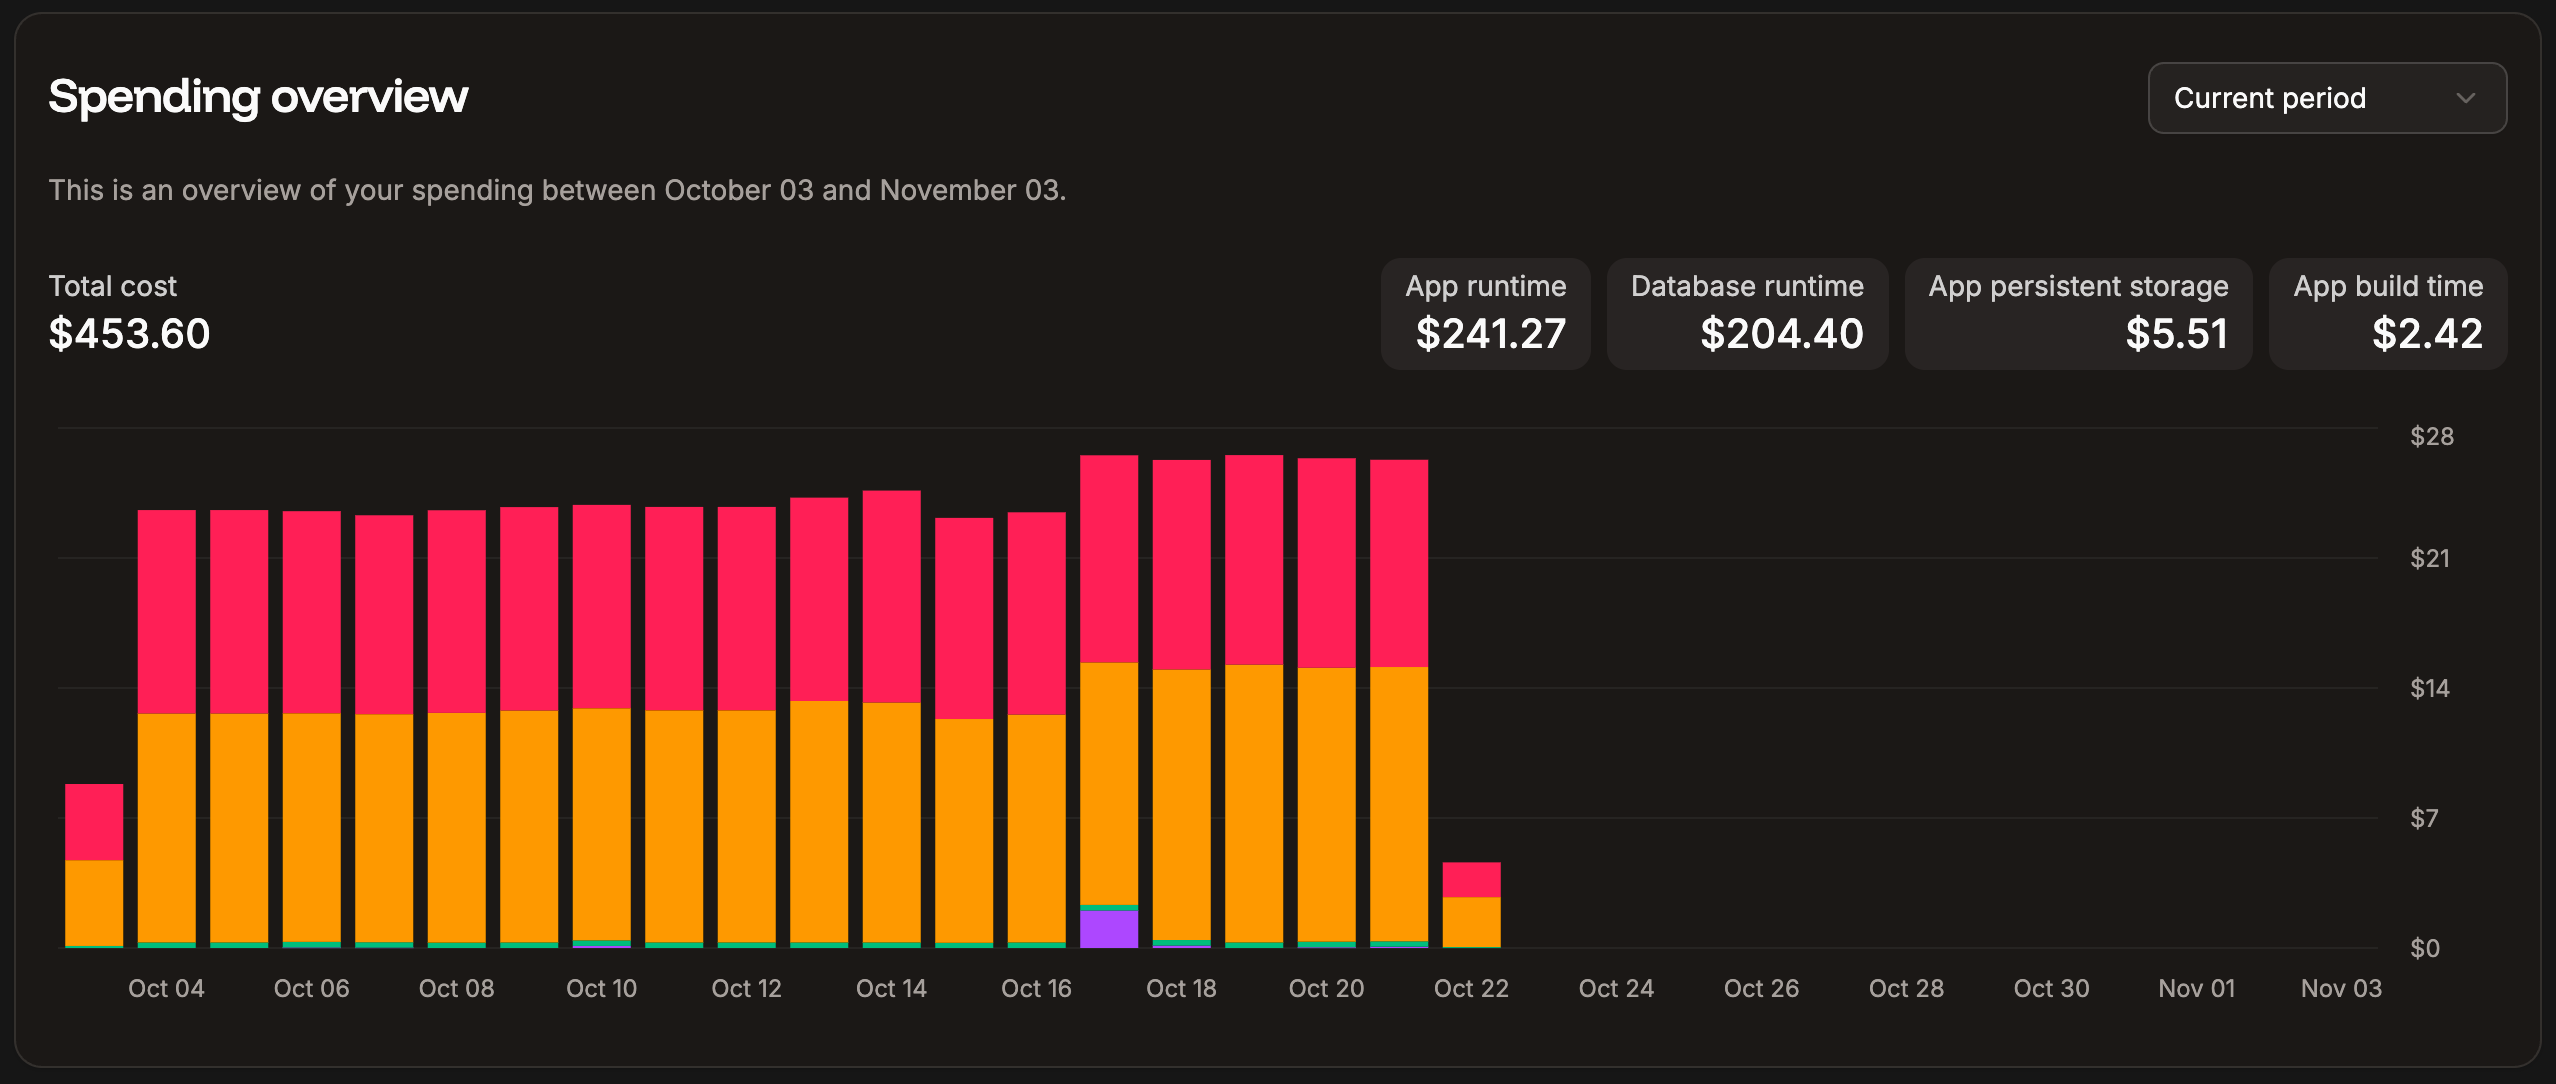
The application billing amounts are also included in the **Spending overview** chart on your Sevalla Dashboard. This chart shows the spending overview for all Sevalla services.
 ## Application analytics
Each application's analytics is broken down into:
* **Compute:** The resources you use for your application.
* **Web:** Information about the requests to your application.
When viewing the application analytics, you can choose to see data for the past 1 hour, 6 hours, 12 hours, 1 day, 2 days, 4 days, 7 days, 14 days, or 30 days, or select a specific date and time period. You can refresh the chart data at any time.
When you hover over a chart, a corresponding reference line appears on the other charts on the same page. You can click and drag this reference line to zoom into a specific time period, and all charts on the page will update to show that same time range.
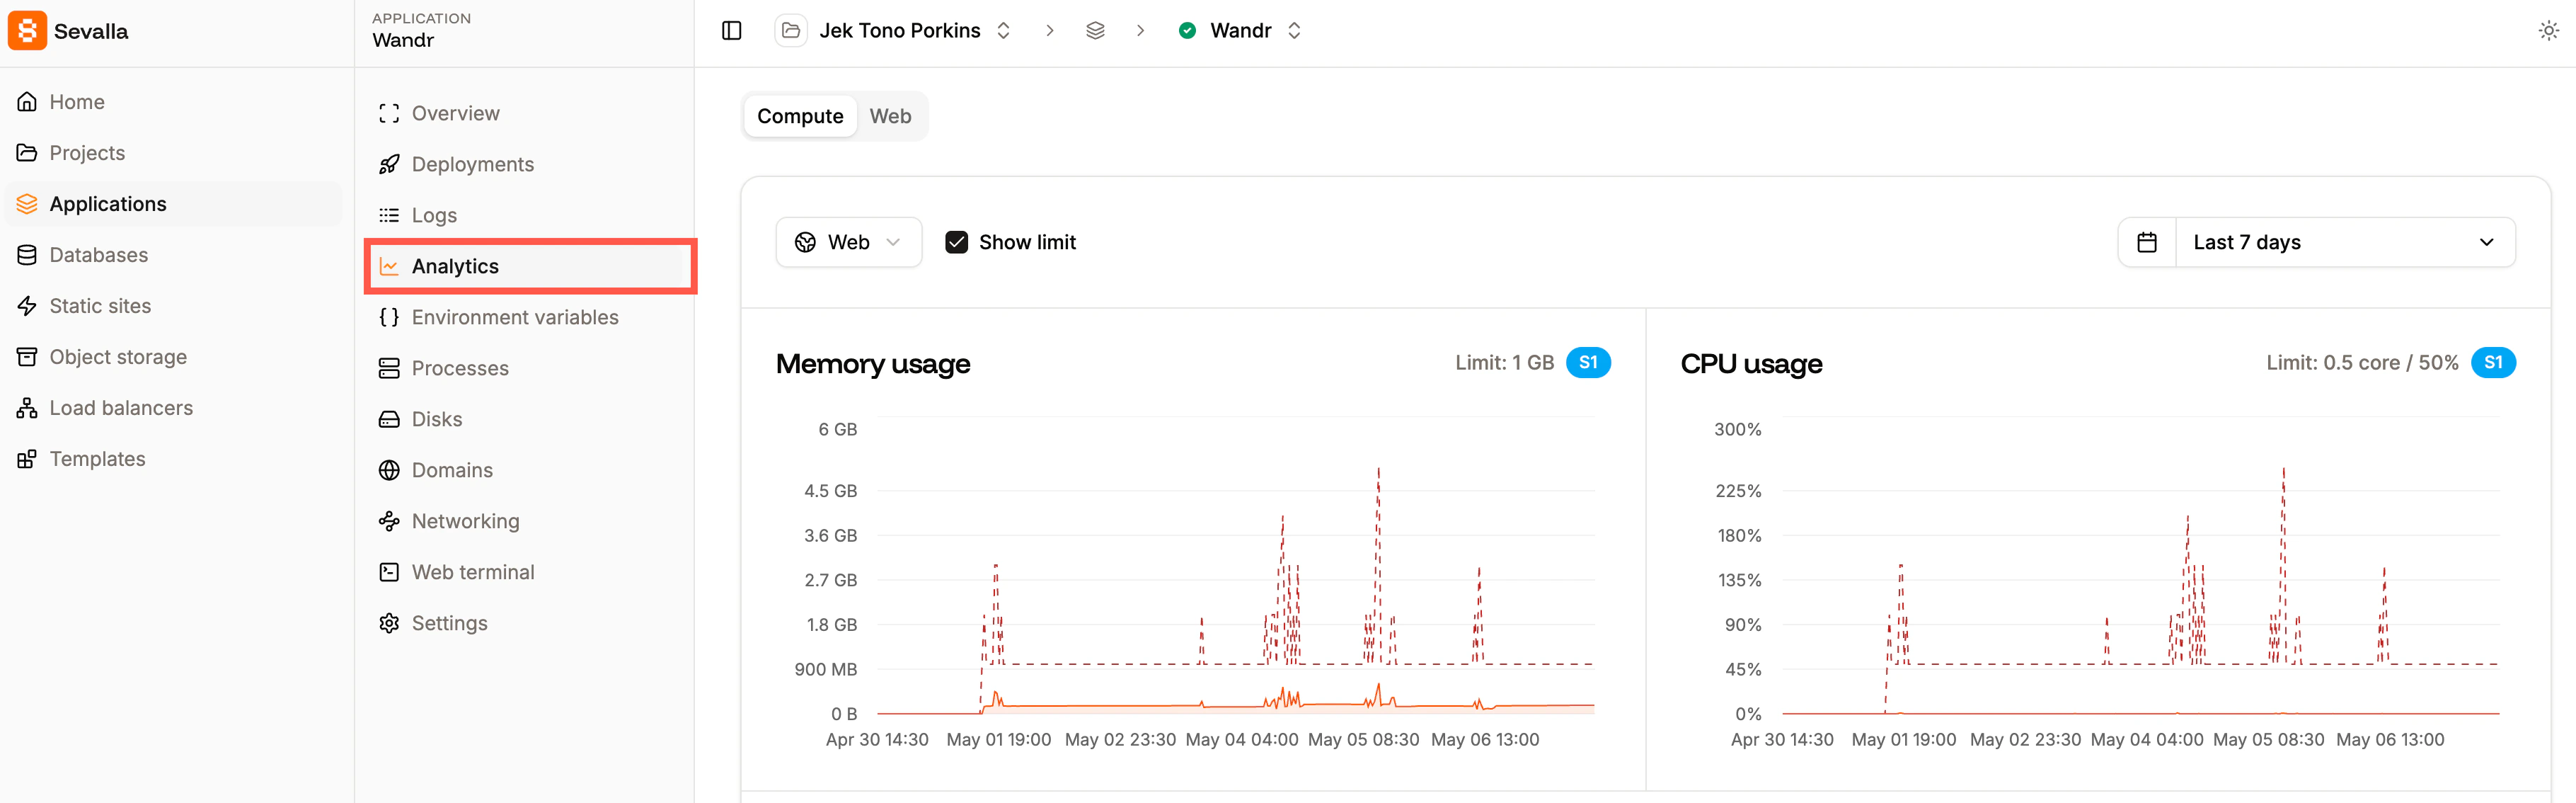
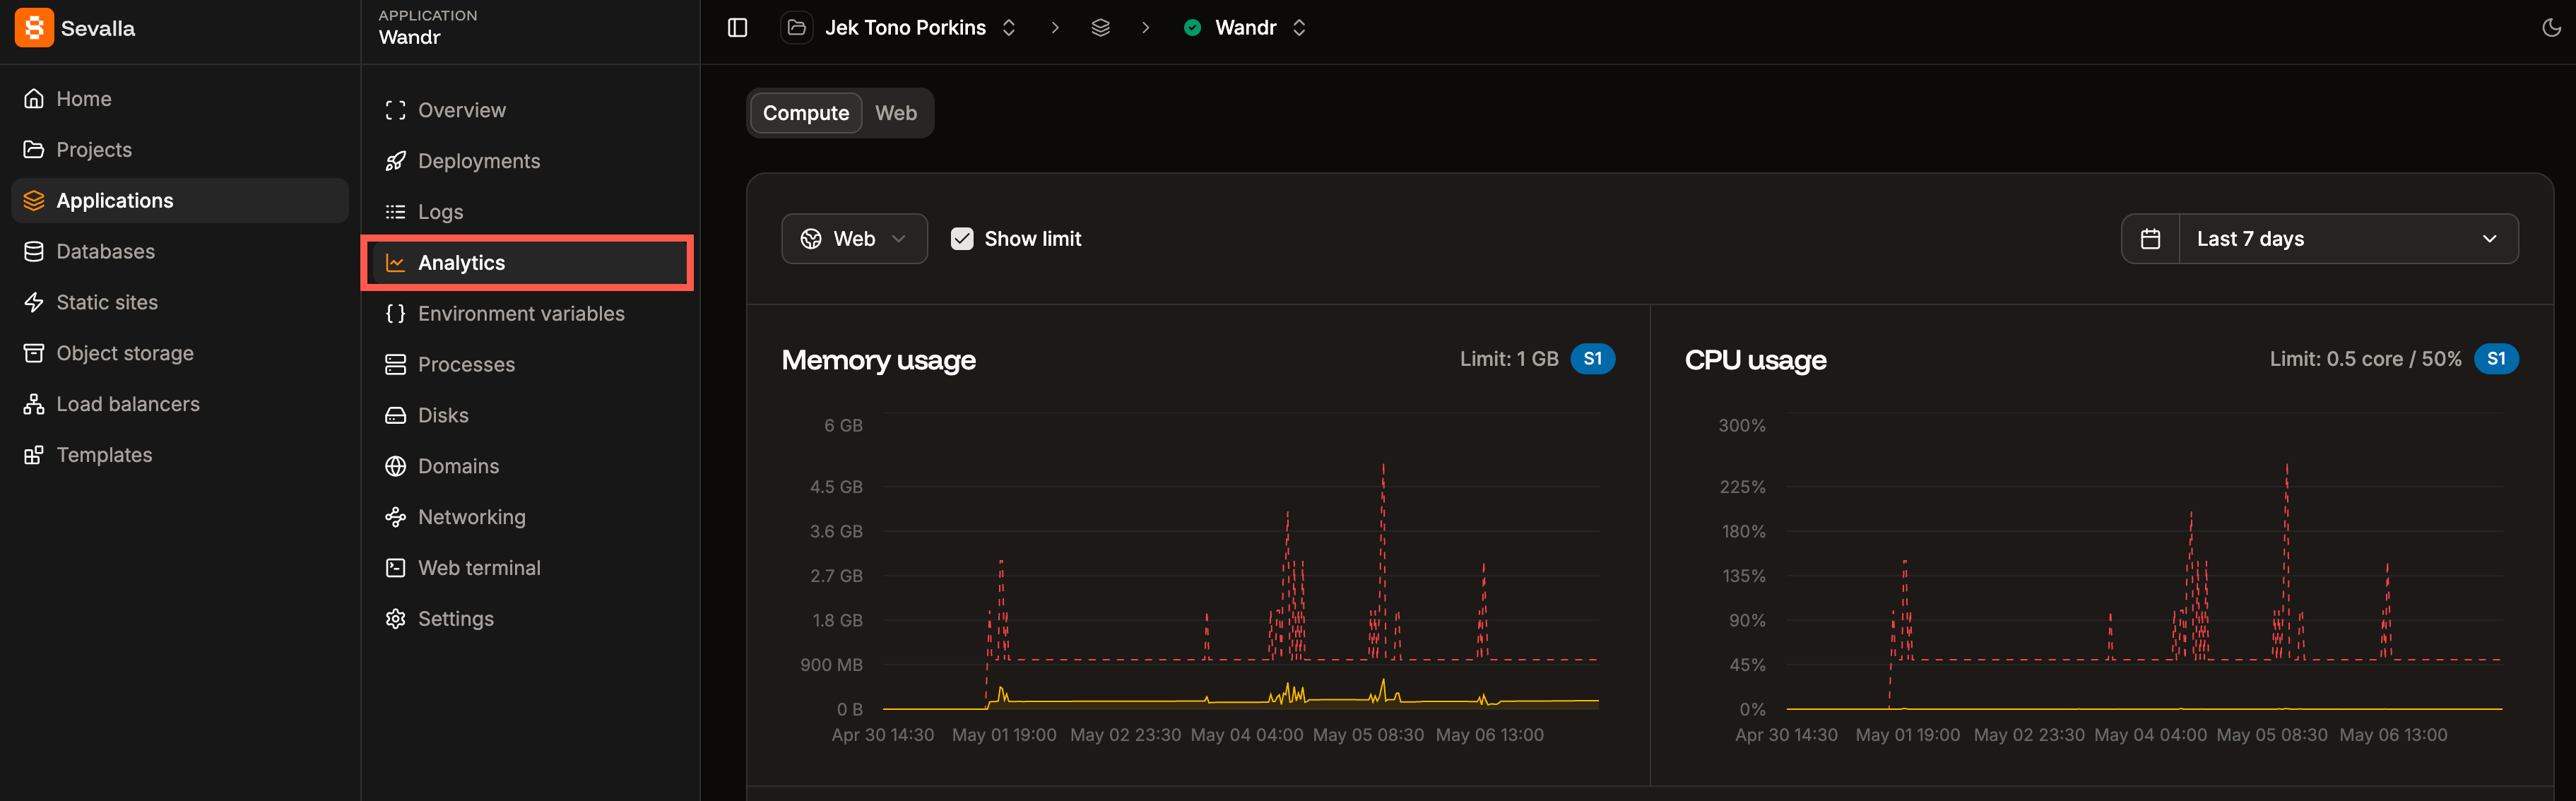
To access these in-depth reports, go to your application's **Analytics** page (**Applications** > ***appname*** > **Analytics**).
## Application analytics
Each application's analytics is broken down into:
* **Compute:** The resources you use for your application.
* **Web:** Information about the requests to your application.
When viewing the application analytics, you can choose to see data for the past 1 hour, 6 hours, 12 hours, 1 day, 2 days, 4 days, 7 days, 14 days, or 30 days, or select a specific date and time period. You can refresh the chart data at any time.
When you hover over a chart, a corresponding reference line appears on the other charts on the same page. You can click and drag this reference line to zoom into a specific time period, and all charts on the page will update to show that same time range.
To access these in-depth reports, go to your application's **Analytics** page (**Applications** > ***appname*** > **Analytics**).
 ### Compute
Using the dropdown within Compute, you can view the information for your web process, a background worker, or a cron job. Select **Show limit** to compare your usage with your current plan limit.
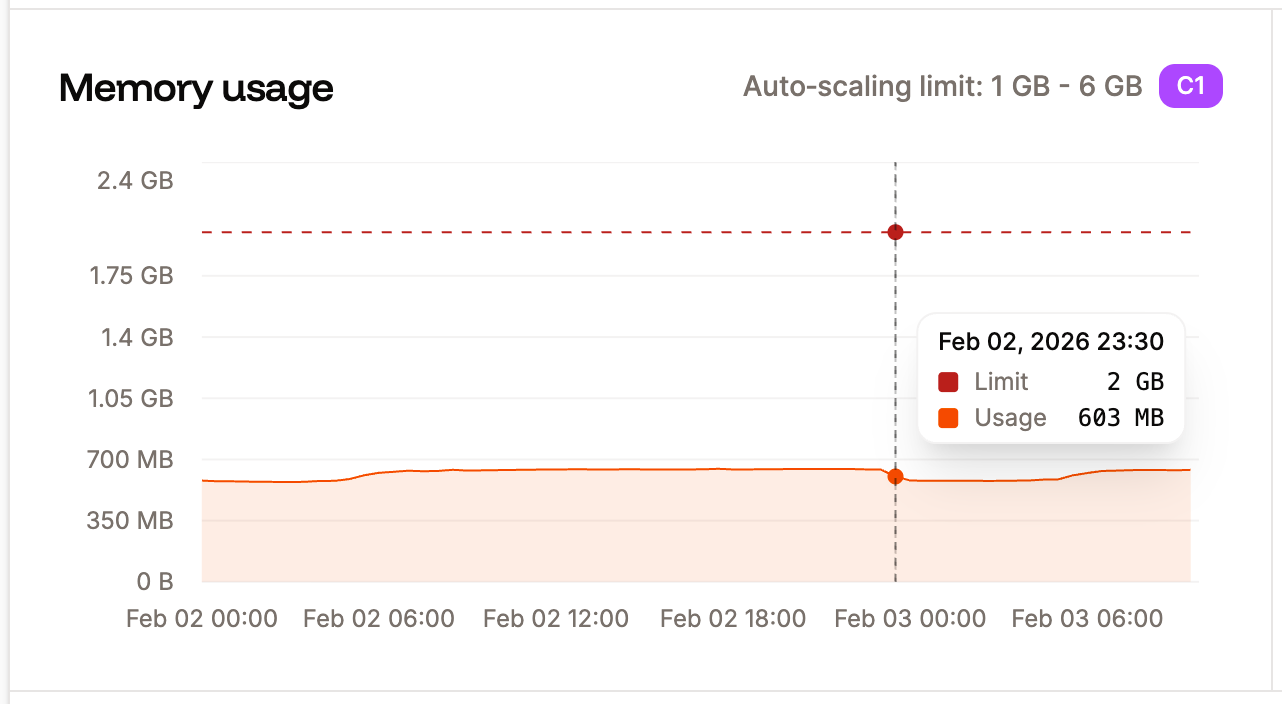
#### Memory usage
The Memory usage chart shows the average of the total memory (RAM) used for the selected time period. If a process uses most or all of the memory available, we recommend upgrading to an [application hosting pod](/billing/application-pricing) with more available memory.
### Compute
Using the dropdown within Compute, you can view the information for your web process, a background worker, or a cron job. Select **Show limit** to compare your usage with your current plan limit.
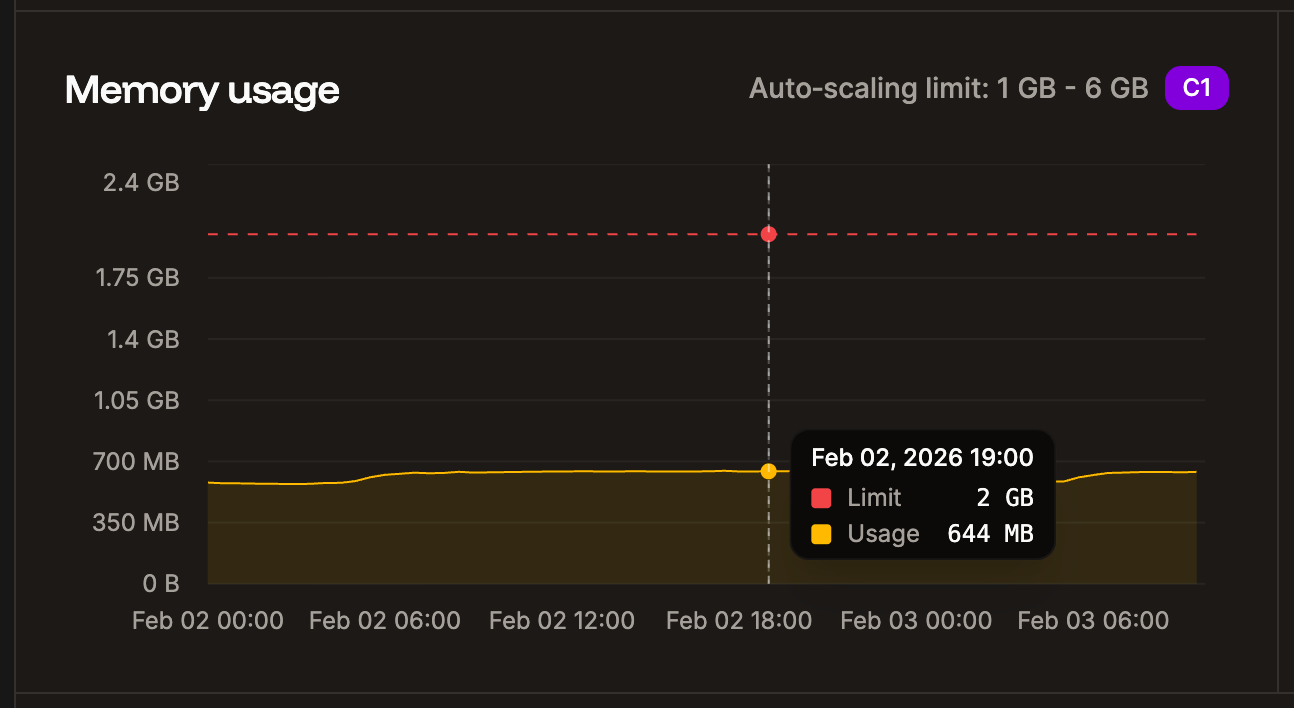
#### Memory usage
The Memory usage chart shows the average of the total memory (RAM) used for the selected time period. If a process uses most or all of the memory available, we recommend upgrading to an [application hosting pod](/billing/application-pricing) with more available memory.
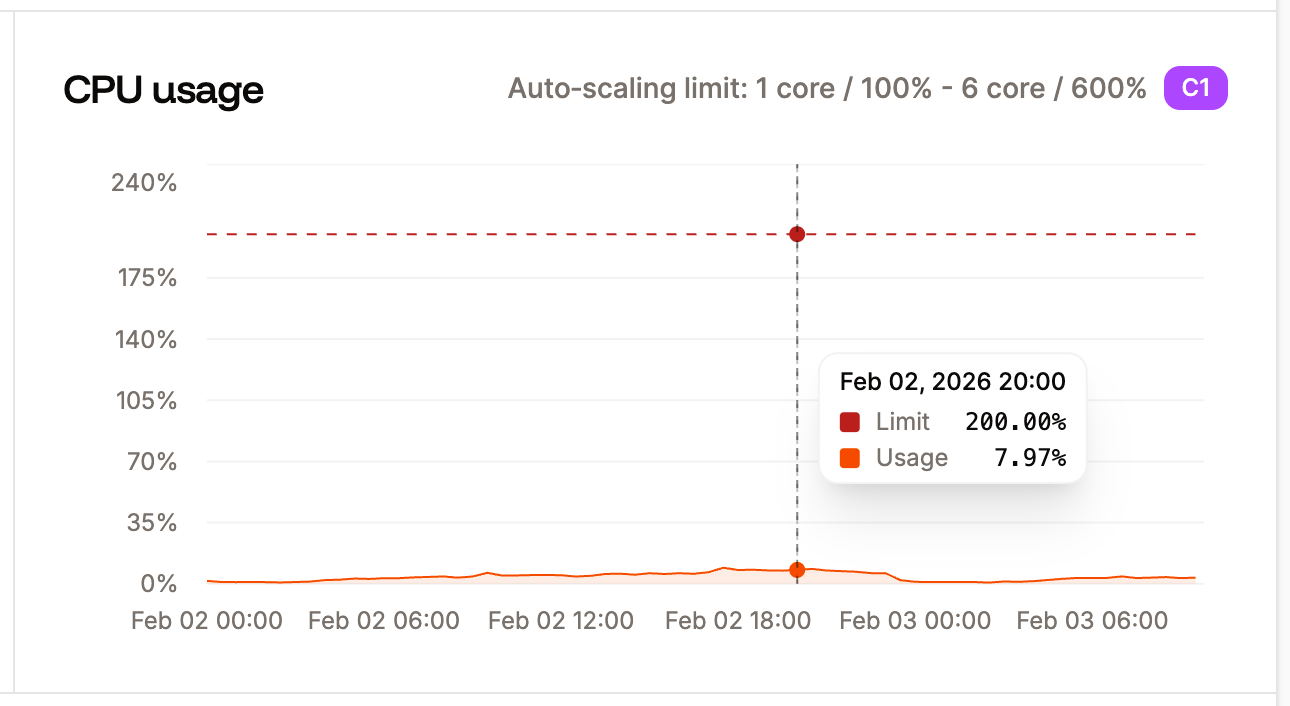
 #### CPU usage
In the CPU usage chart, you can see the average of the total CPU utilization for the selected time period, expressed as a percentage of the instance's CPU resources. If you see a high percentage of CPU usage (near 100%), we recommend upgrading to an [application hosting pod](/billing/application-pricing) with more CPU for that process. If your application is stateless (no [persistent storage](/applications/storage)), you also have the option to enable [automatic horizontal scaling](/applications/scalability) for the **web process**. This lets you set a minimum and maximum number of instances (up to 10) that the process can scale between as needed.
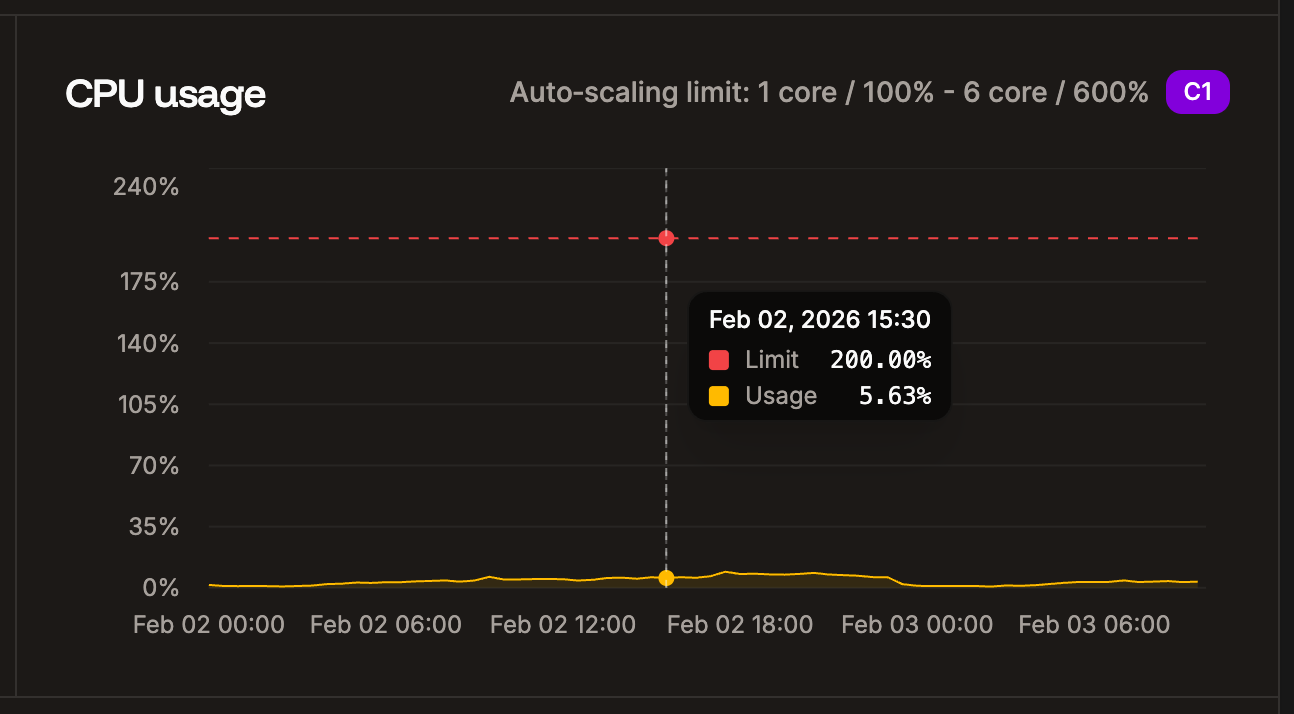
#### CPU usage
In the CPU usage chart, you can see the average of the total CPU utilization for the selected time period, expressed as a percentage of the instance's CPU resources. If you see a high percentage of CPU usage (near 100%), we recommend upgrading to an [application hosting pod](/billing/application-pricing) with more CPU for that process. If your application is stateless (no [persistent storage](/applications/storage)), you also have the option to enable [automatic horizontal scaling](/applications/scalability) for the **web process**. This lets you set a minimum and maximum number of instances (up to 10) that the process can scale between as needed.
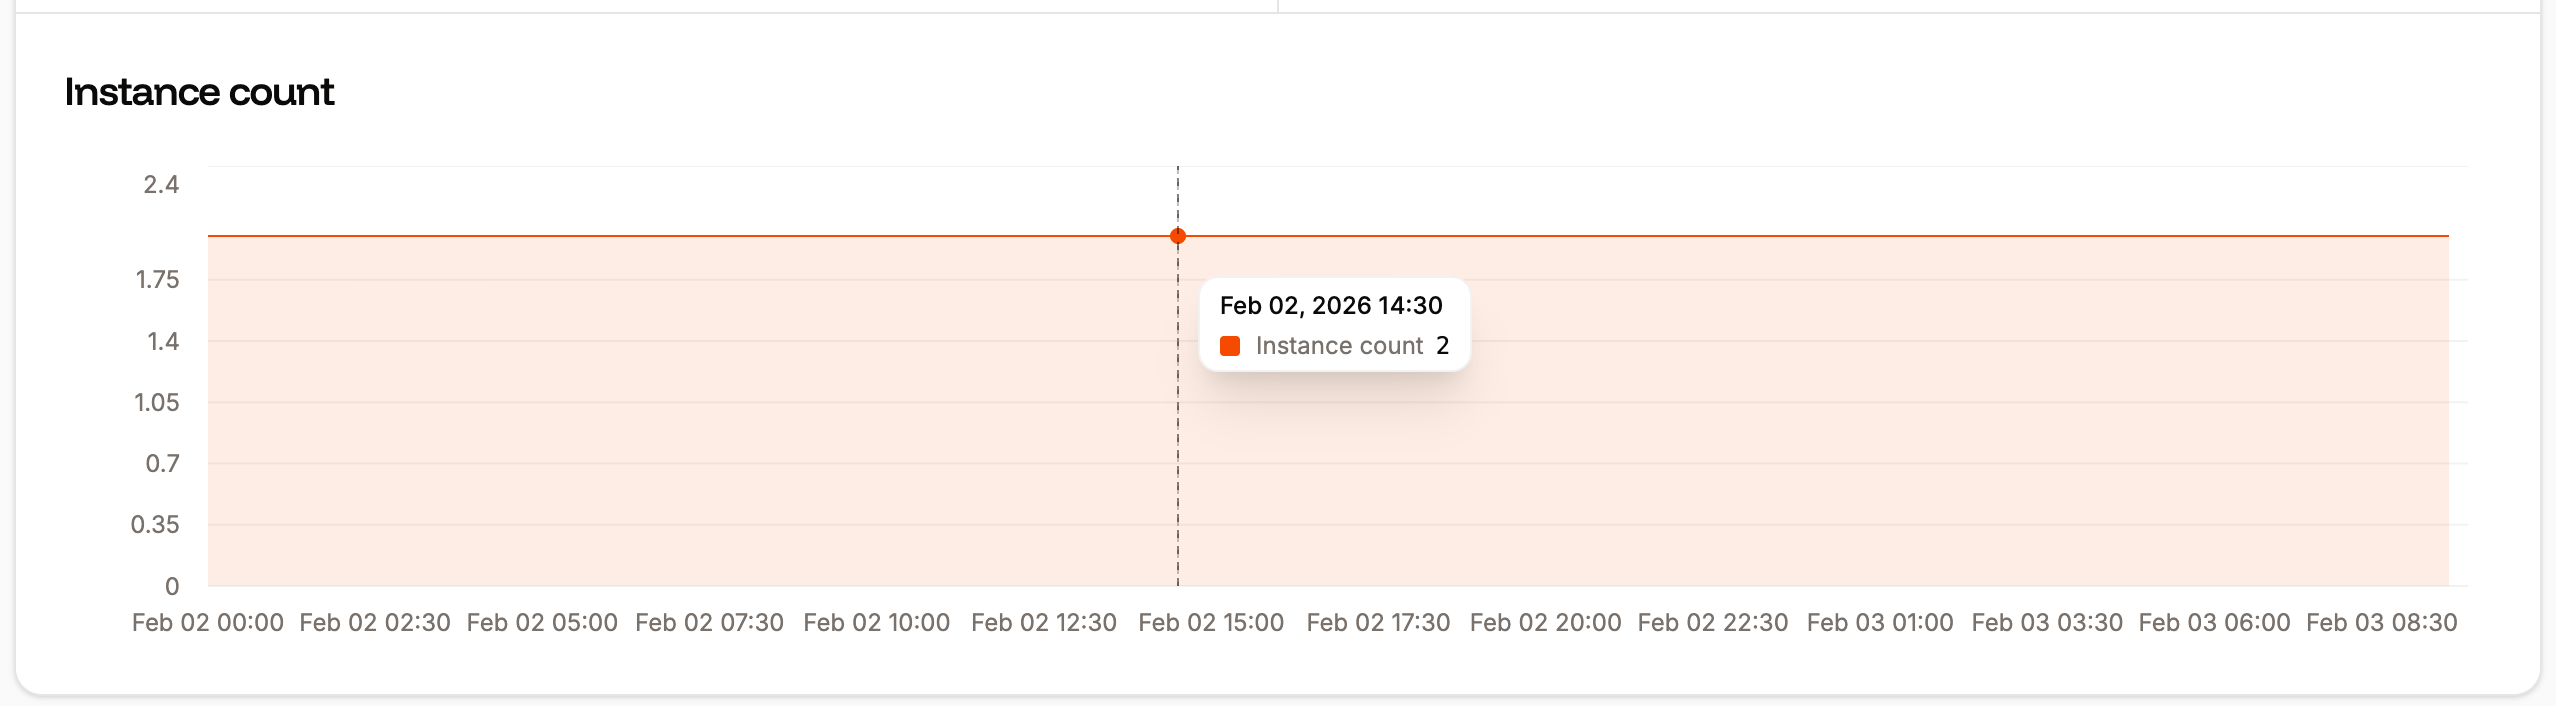
 #### Instance count
The Instance count chart shows the number of instances in use for the selected process and time period. Select **Show limit** to compare your usage to your process resource limit. You can adjust the number of instances for your process within **Processes**, click the kebab (three dots) on the required process, and select **Update process**.
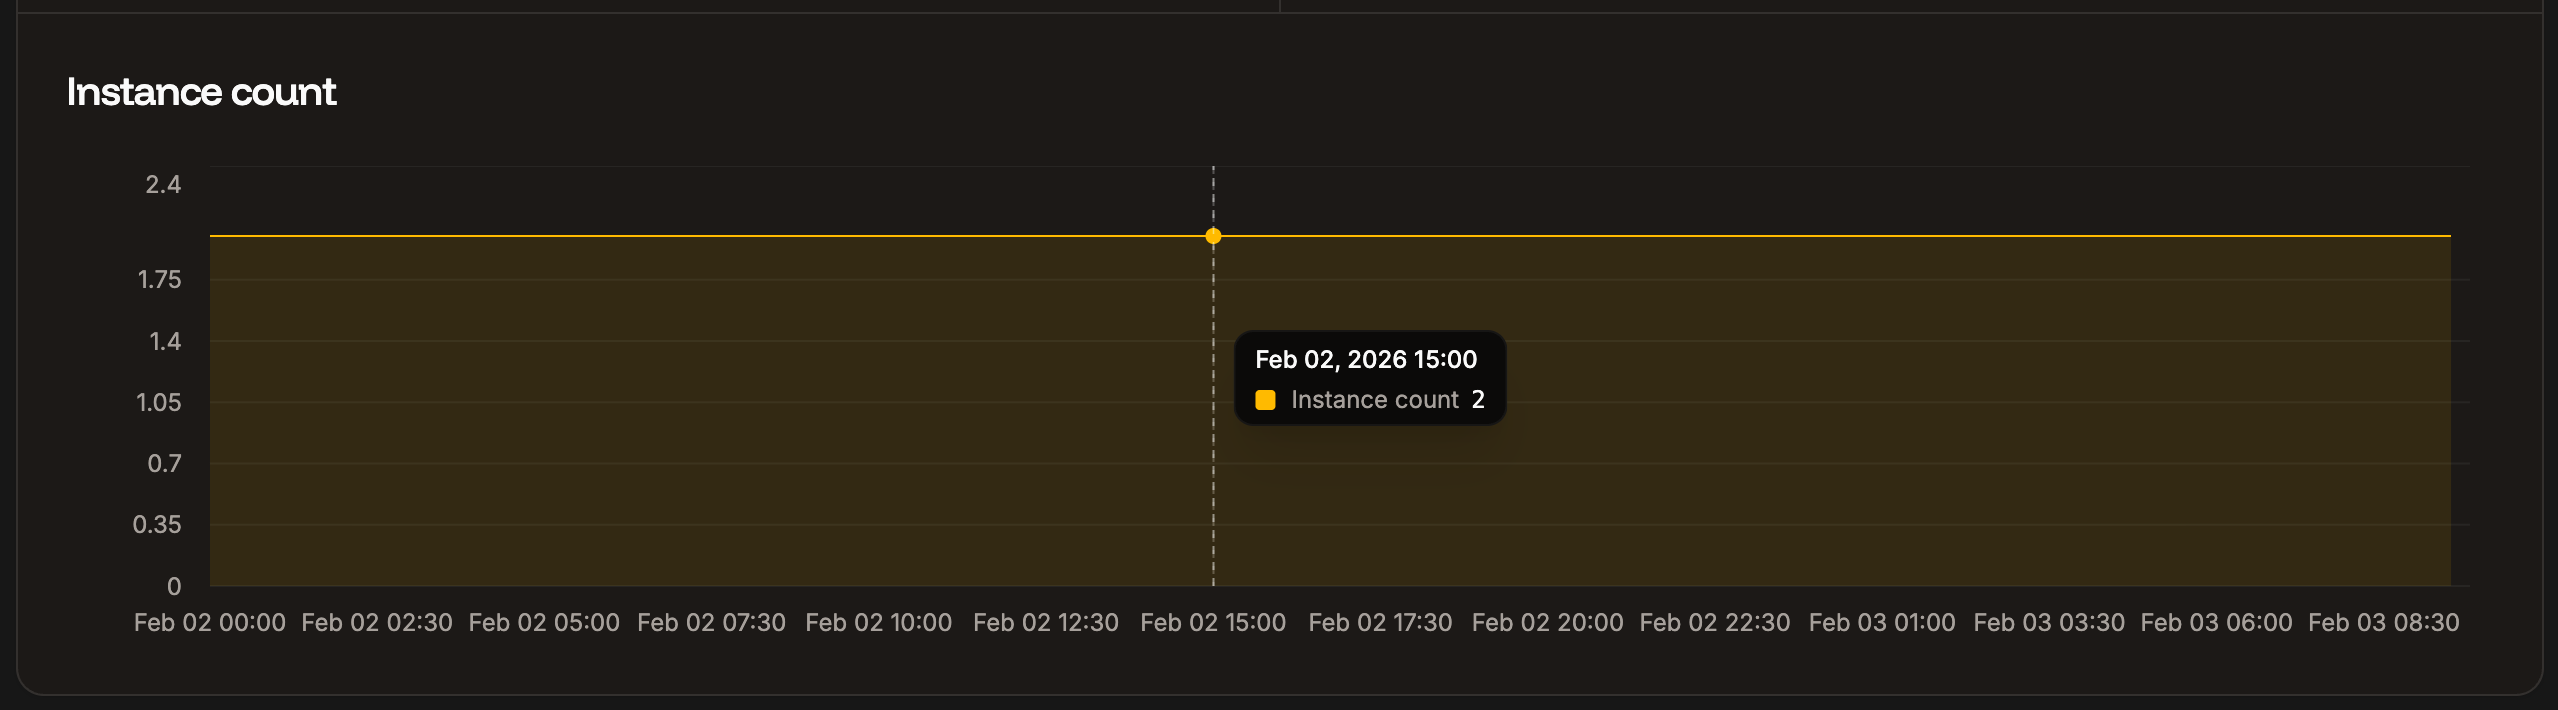
#### Instance count
The Instance count chart shows the number of instances in use for the selected process and time period. Select **Show limit** to compare your usage to your process resource limit. You can adjust the number of instances for your process within **Processes**, click the kebab (three dots) on the required process, and select **Update process**.
 ### Web
You can filter the web charts using **Add filter**. This filters all of the charts on the **Web** page. The following options are available:
* Source IP
* Country
* Device type
* HTTP method
* Path
* User agent
* HTTP version
* Status code
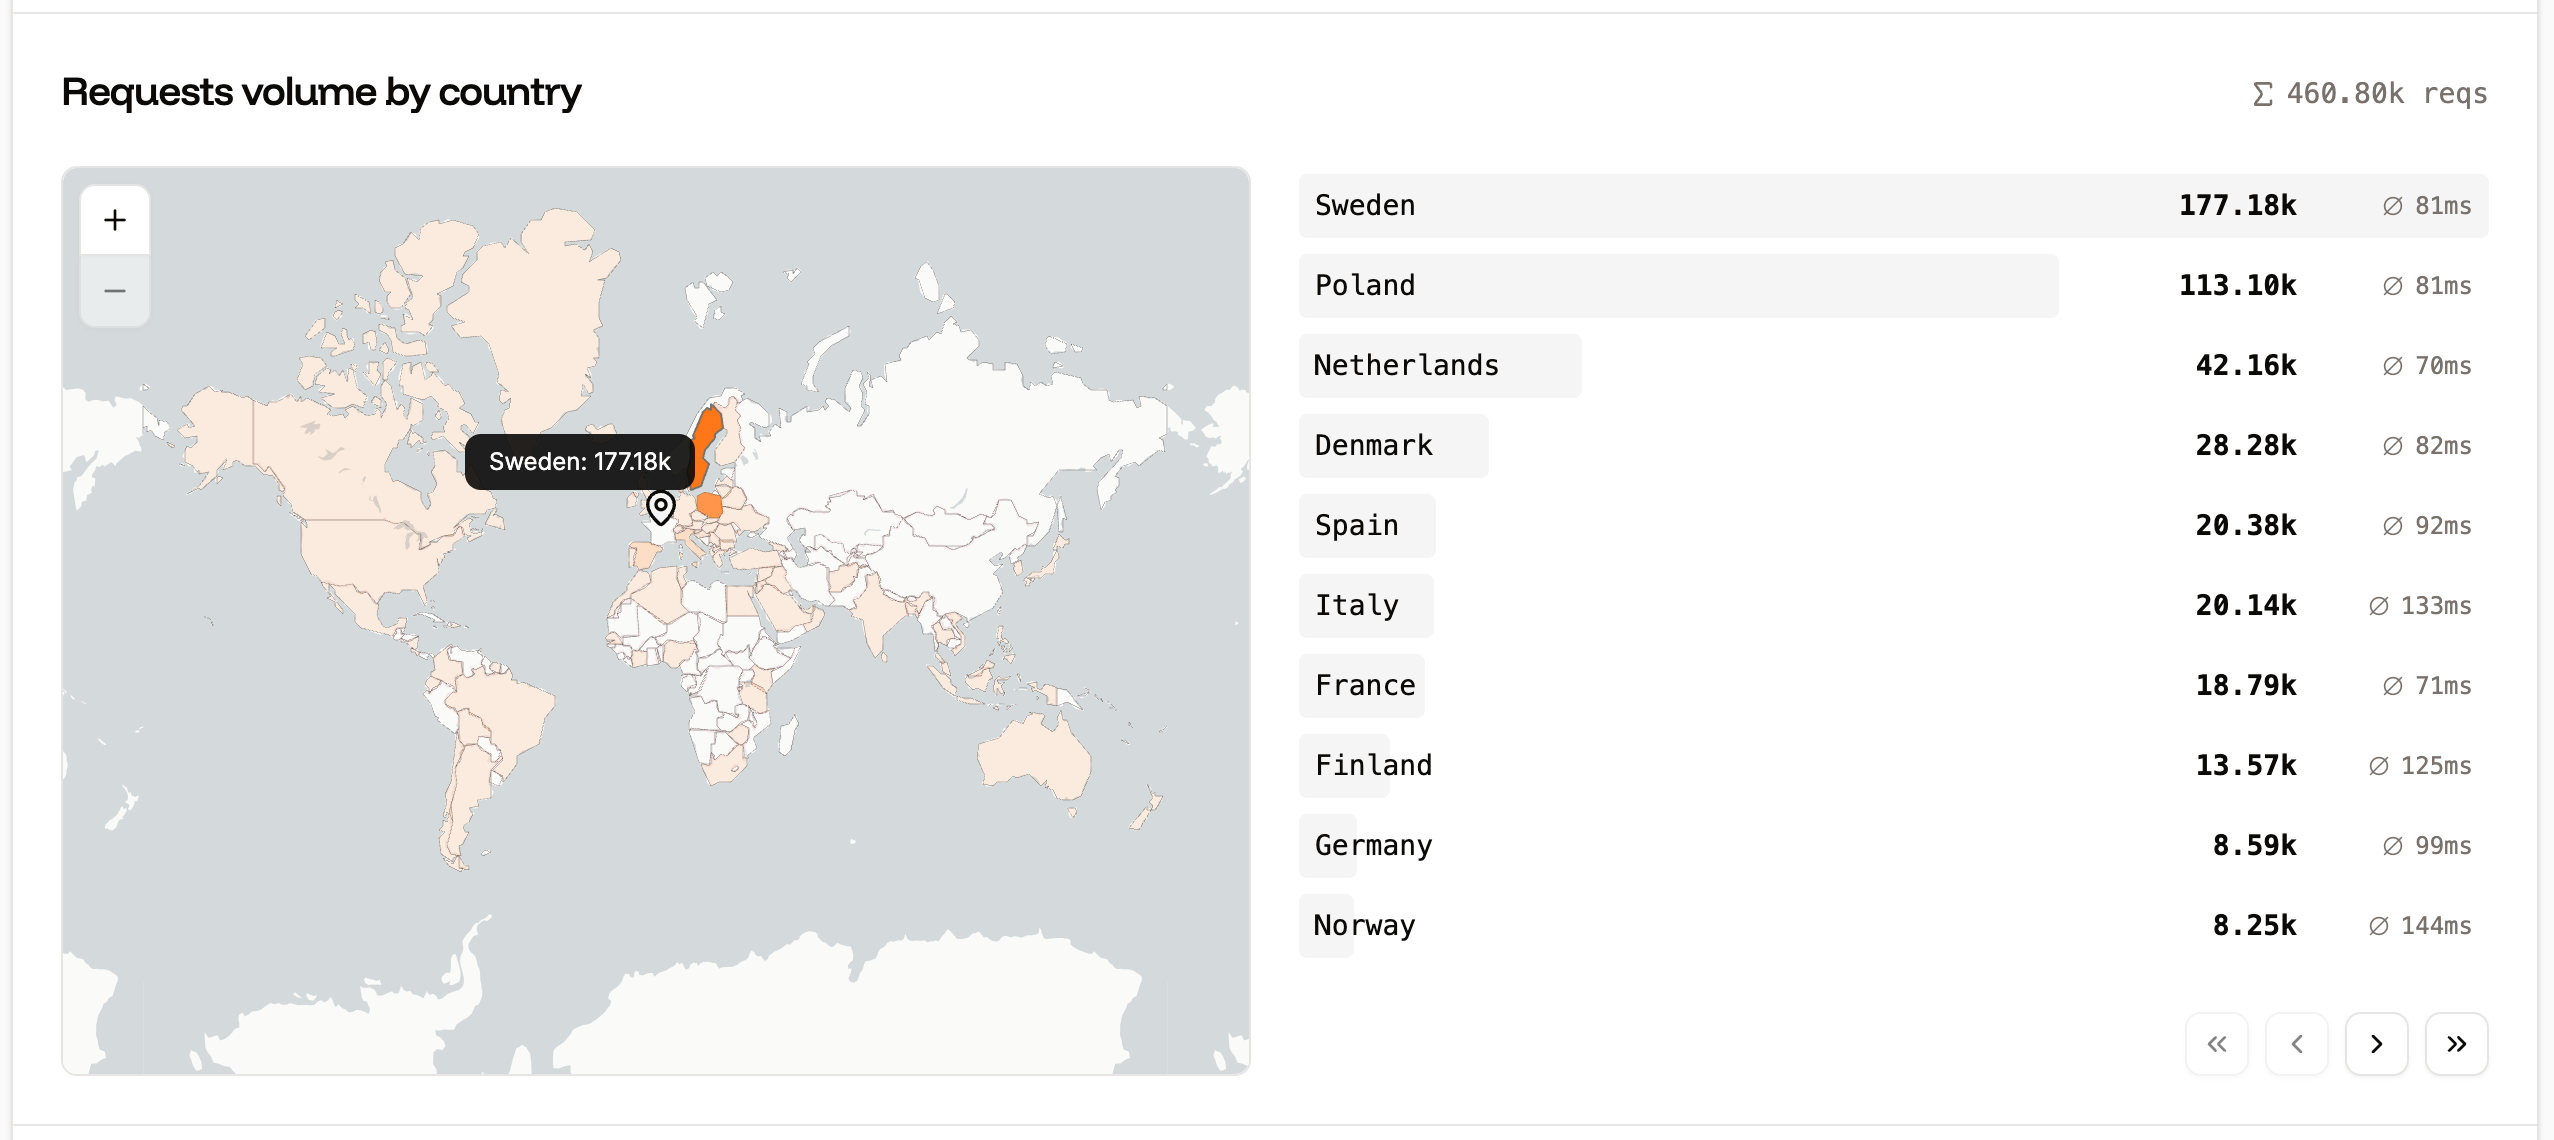
#### Requests volume by country
The Requests volume by country chart displays the number of requests, ranked by the country from which they originated. You can zoom in and out of the map, and hover over a country to see the exact number of requests from that location. You can also filter the chart to include or exclude specific countries.
### Web
You can filter the web charts using **Add filter**. This filters all of the charts on the **Web** page. The following options are available:
* Source IP
* Country
* Device type
* HTTP method
* Path
* User agent
* HTTP version
* Status code
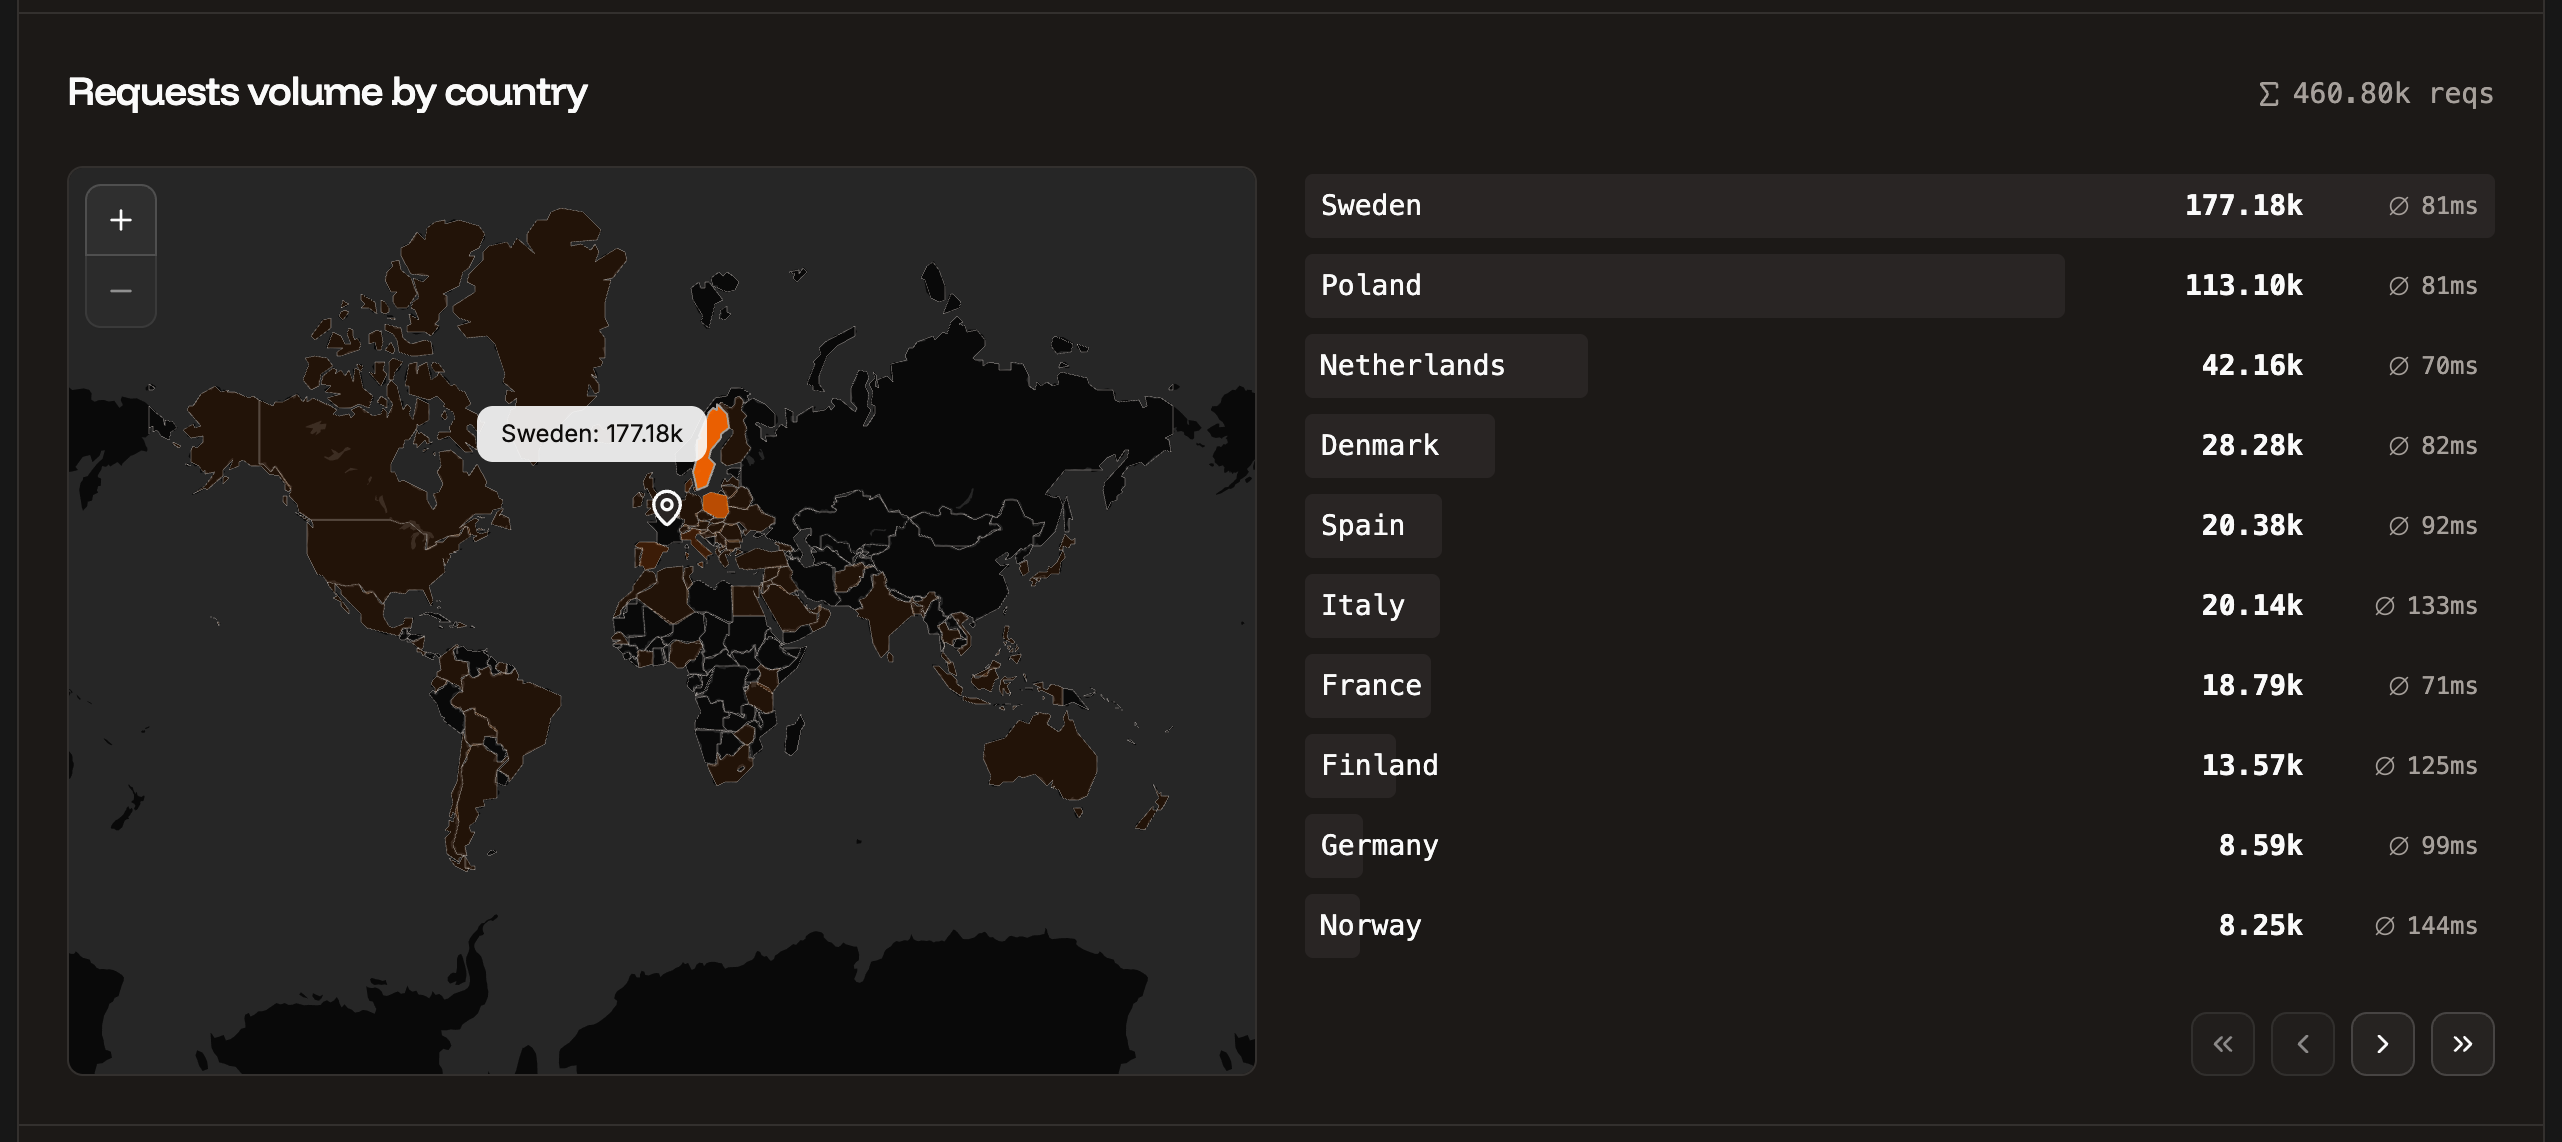
#### Requests volume by country
The Requests volume by country chart displays the number of requests, ranked by the country from which they originated. You can zoom in and out of the map, and hover over a country to see the exact number of requests from that location. You can also filter the chart to include or exclude specific countries.
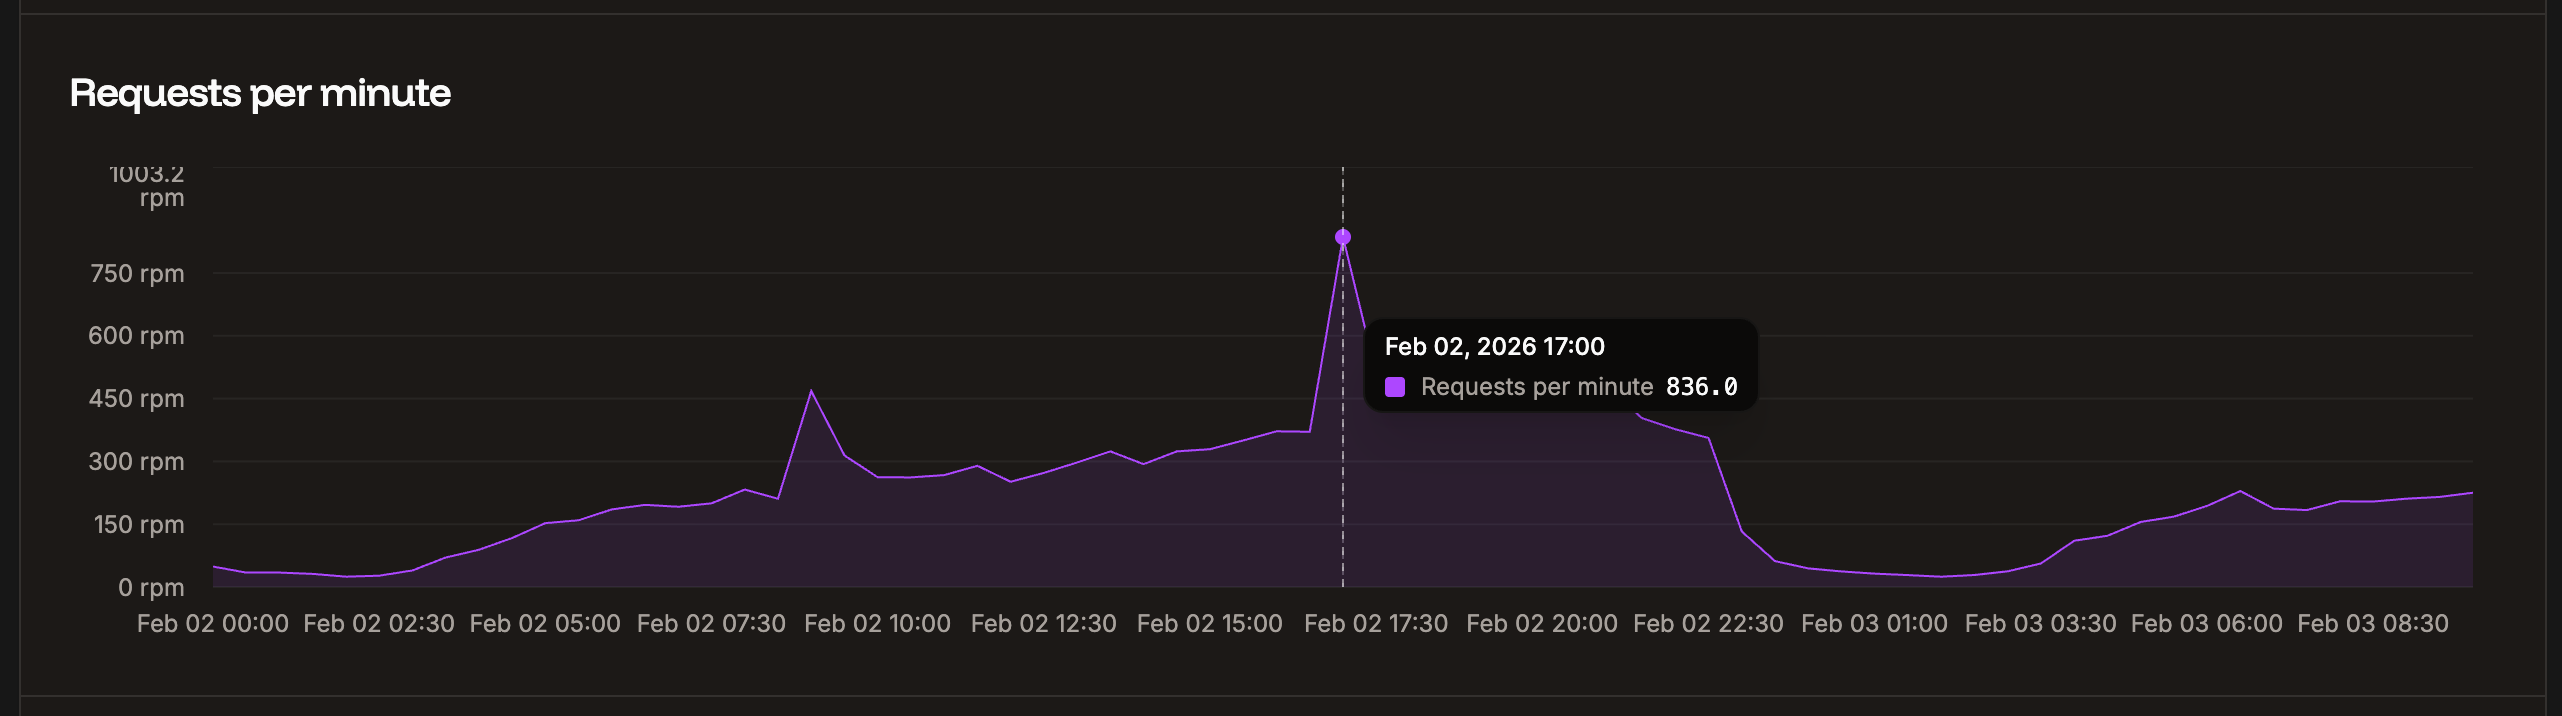
 #### Requests per minute
The Requests per minute chart shows the average requests per minute (RPM) of all HTTP requests for the time period selected.
#### Requests per minute
The Requests per minute chart shows the average requests per minute (RPM) of all HTTP requests for the time period selected.

 #### Bandwidth
The Bandwidth chart shows your bandwidth usage over the selected timeframe.
#### Bandwidth
The Bandwidth chart shows your bandwidth usage over the selected timeframe.

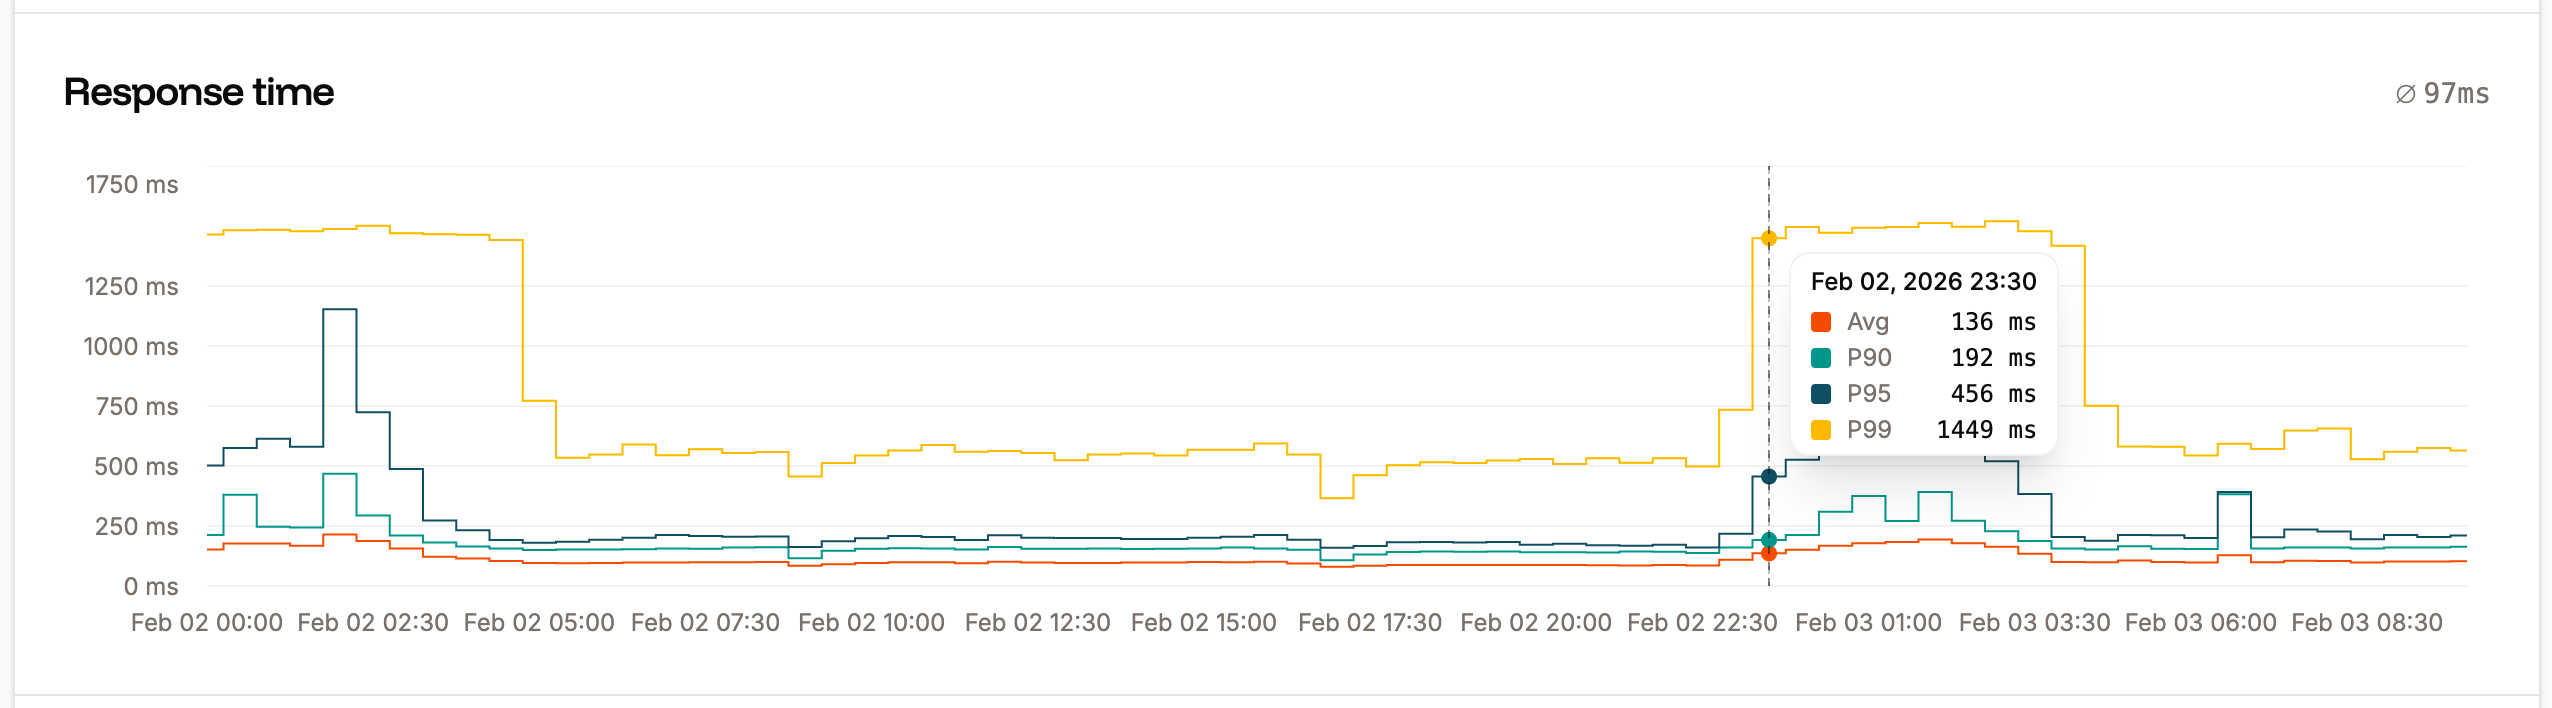
 #### Response time
The Response time chart shows the average response time for all HTTP requests for the time period selected.
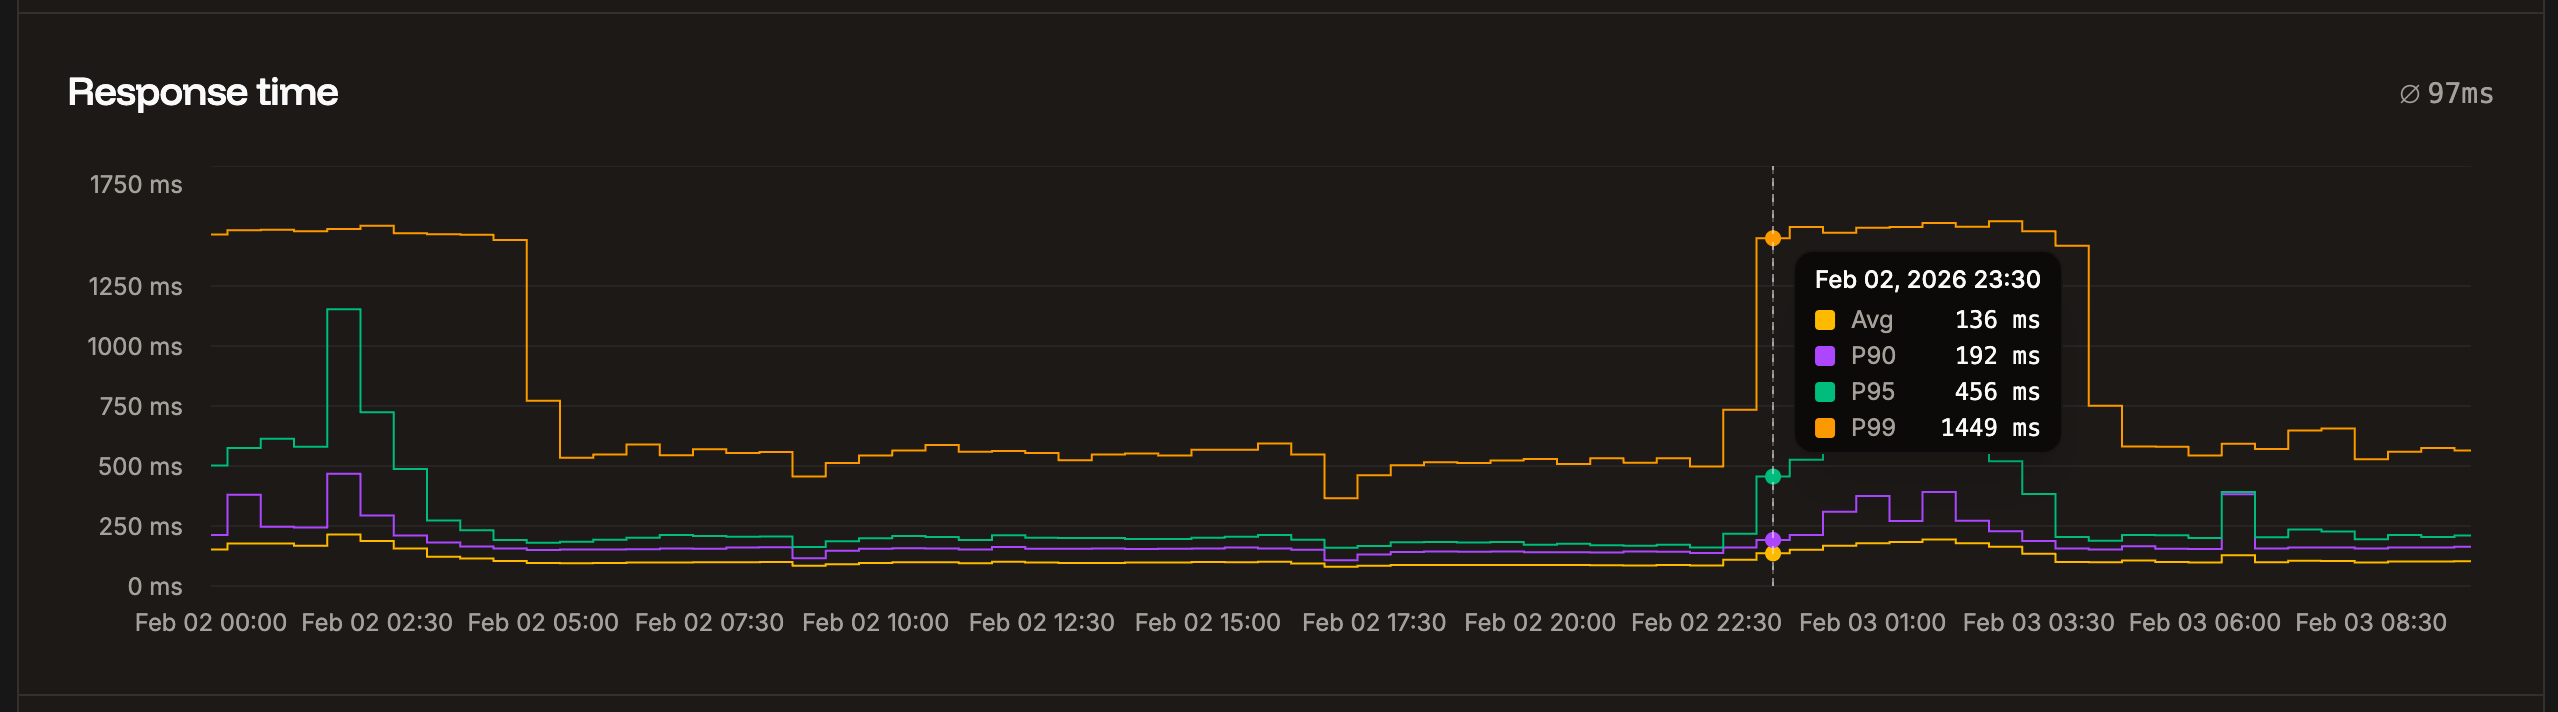
#### Response time
The Response time chart shows the average response time for all HTTP requests for the time period selected.
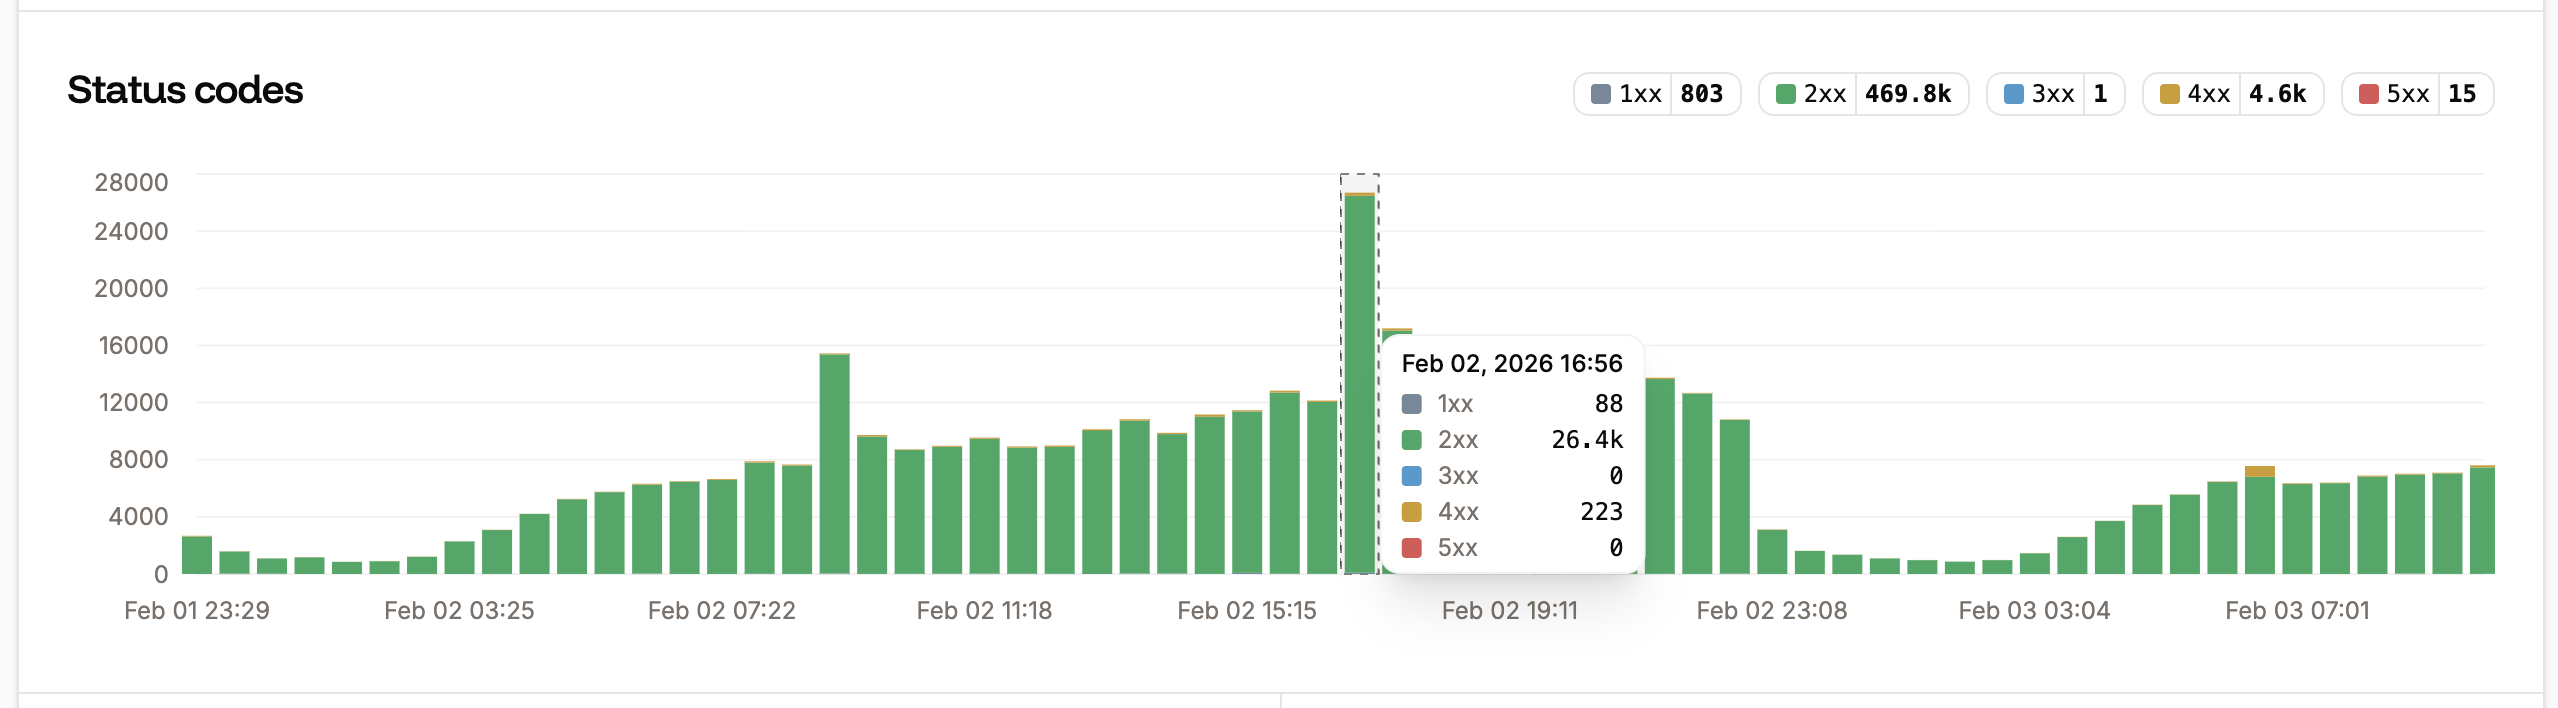
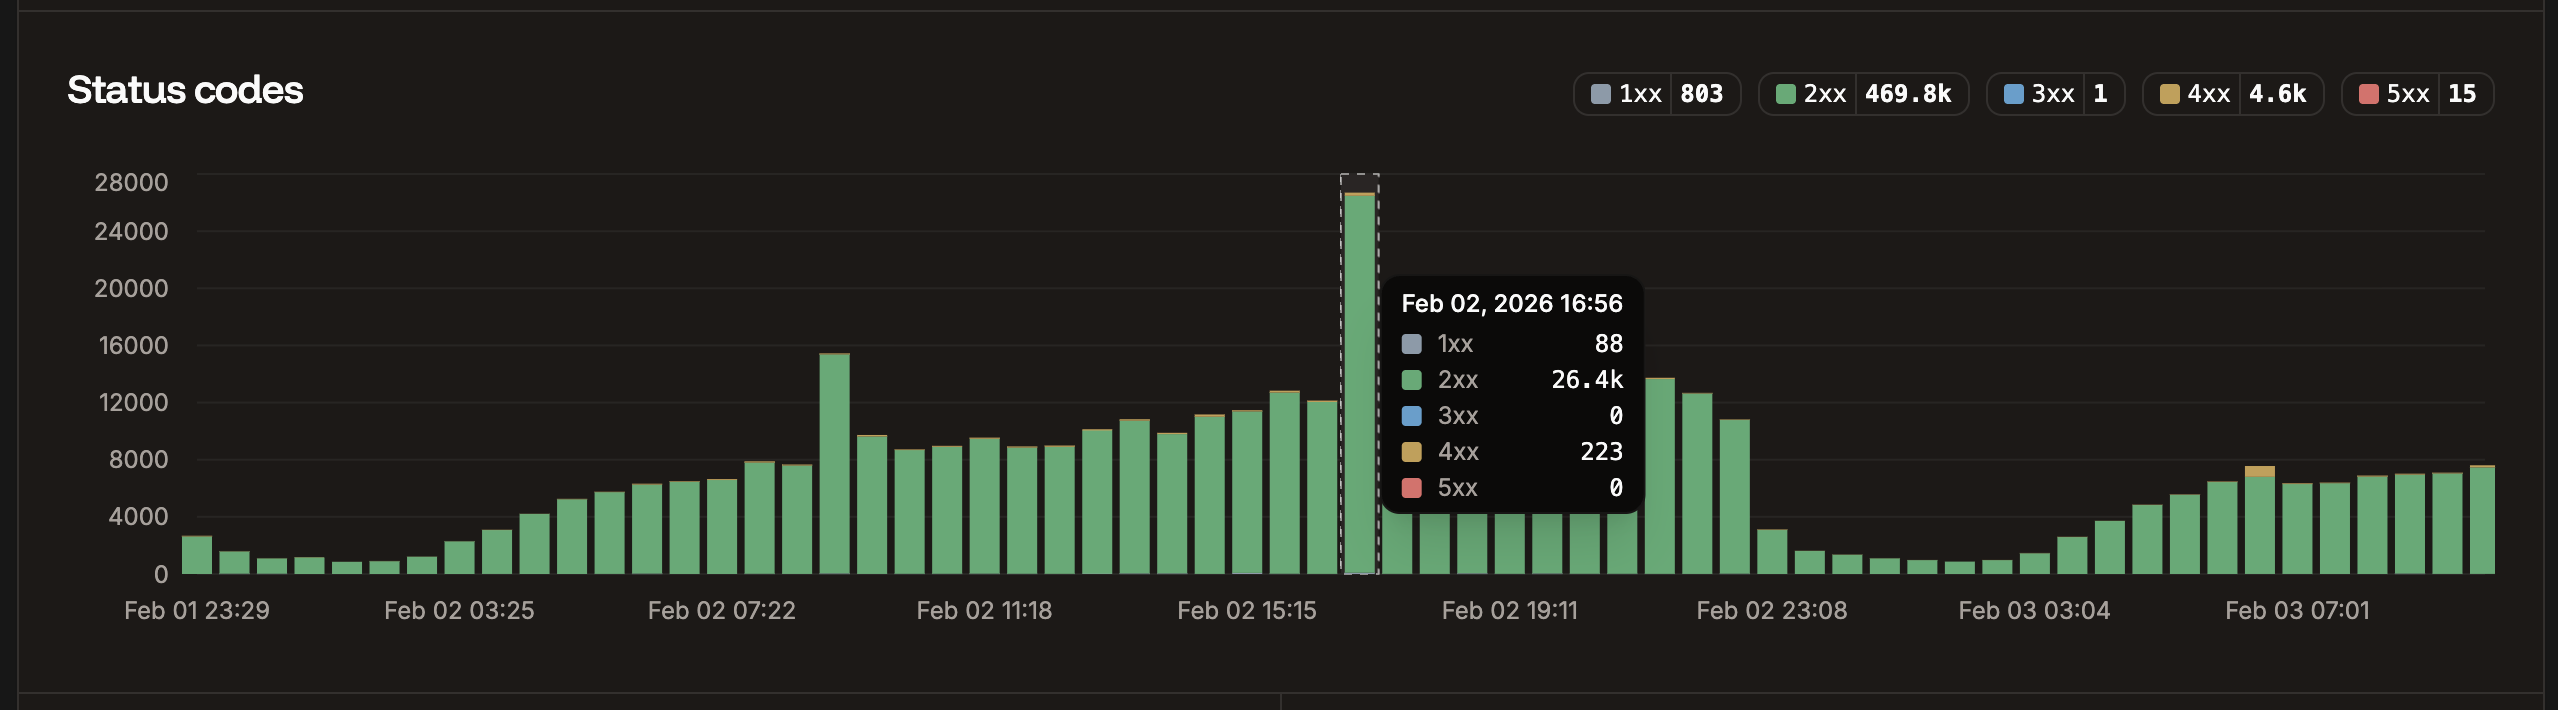
 #### Status codes
The Status codes chart displays the total number of each status code returned for requests. This is useful for analyzing your site to identify when requests return codes other than 200.
#### Status codes
The Status codes chart displays the total number of each status code returned for requests. This is useful for analyzing your site to identify when requests return codes other than 200.
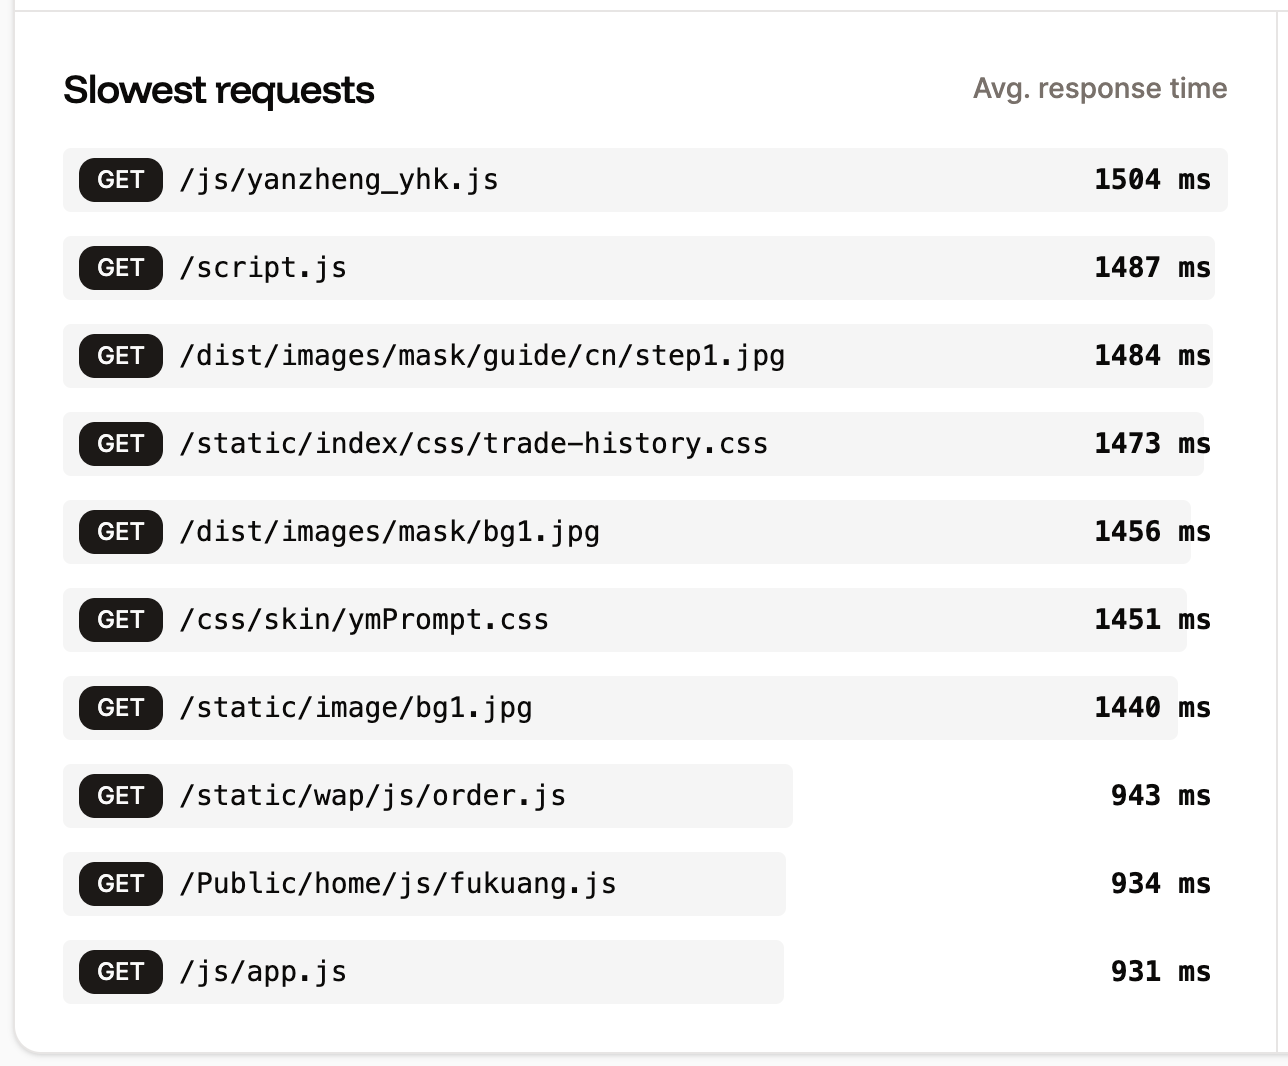
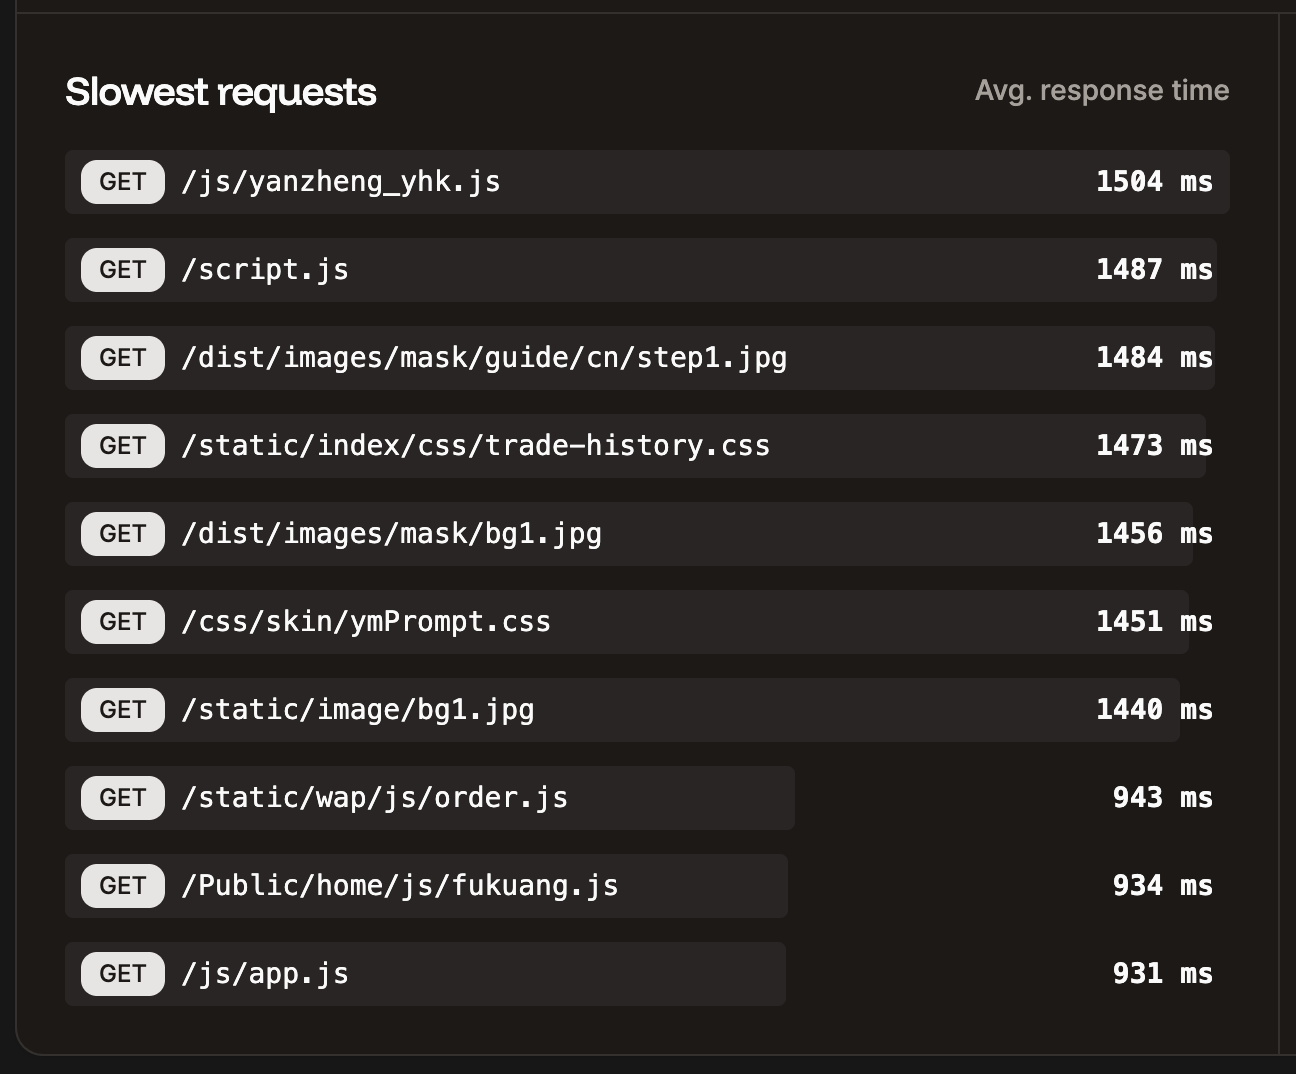
 #### Slowest requests
The slowest requests table shows the 10 slowest requests to your application for the selected time period and the average response time it took to complete.
#### Slowest requests
The slowest requests table shows the 10 slowest requests to your application for the selected time period and the average response time it took to complete.
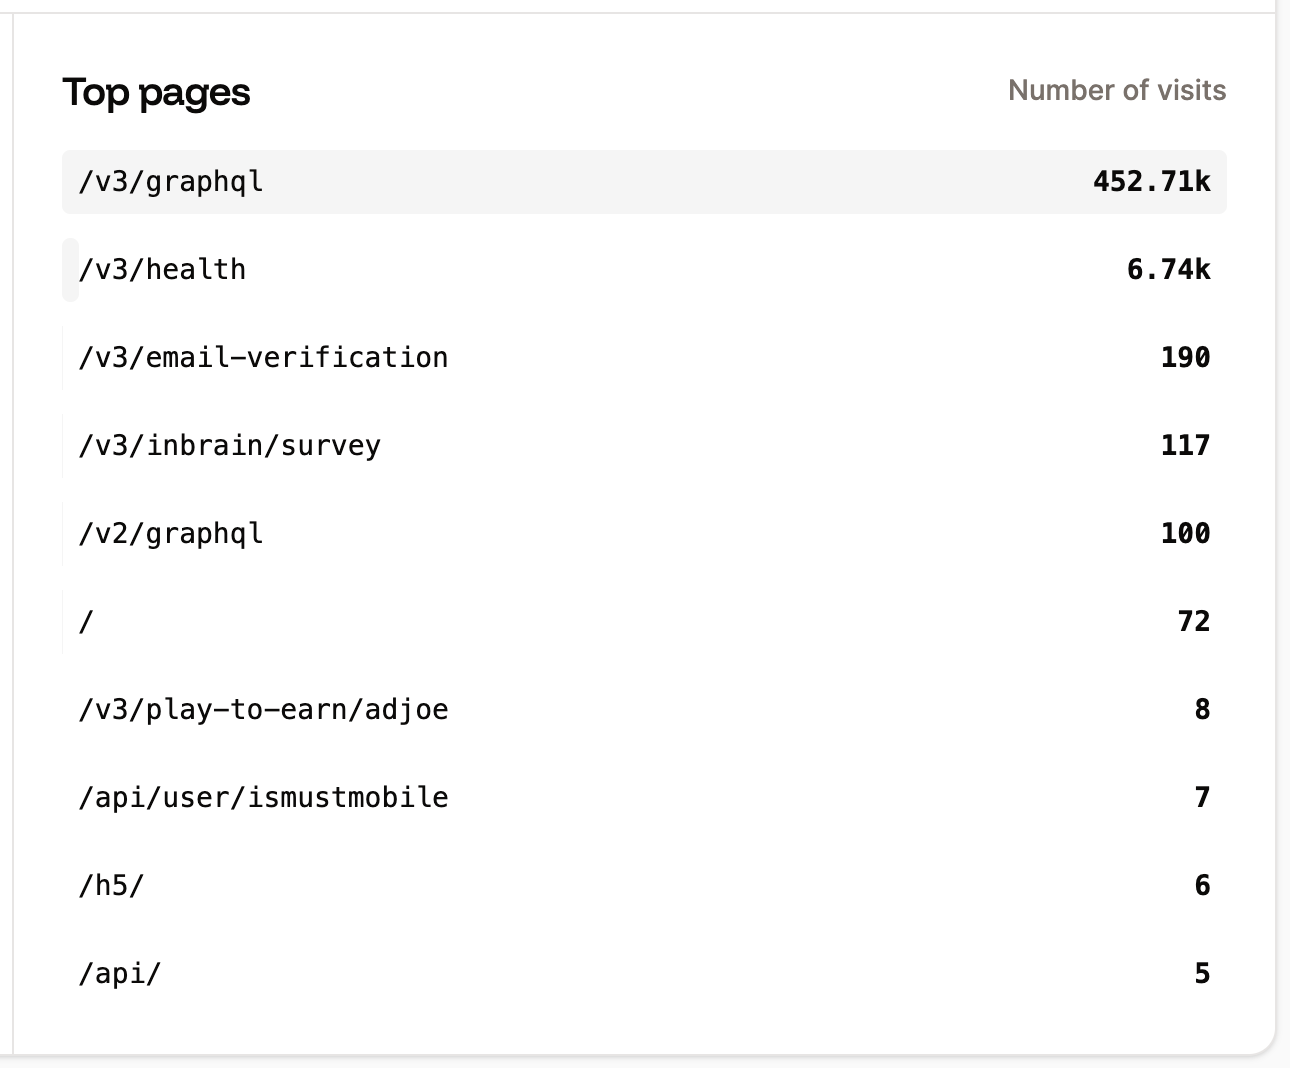
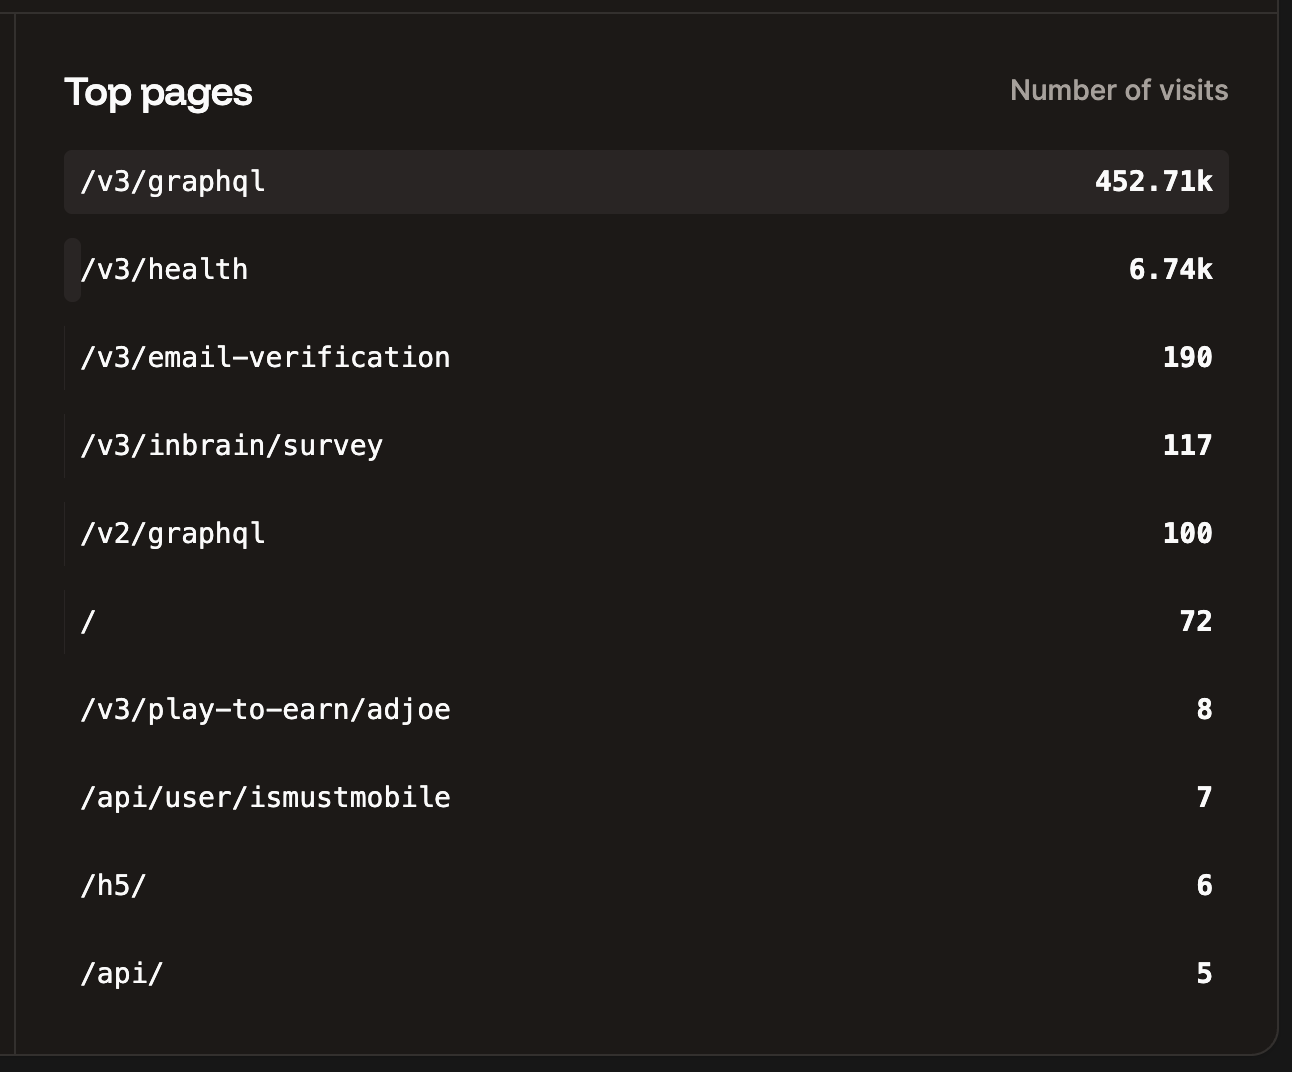
 #### Top pages
The Top pages table shows the top 10 most requested pages by the number of views for your application.
#### Top pages
The Top pages table shows the top 10 most requested pages by the number of views for your application.
 ## Additional notes
Analytics data is retained for 30 days. We suggest checking your **Application Analytics** frequently after first deploying to Sevalla and periodically after that. If you see any unexplained analytics data or inconsistencies that concern you, [let our Support team know](/support/contact-support/), and we can further investigate to help determine the cause.
## Additional notes
Analytics data is retained for 30 days. We suggest checking your **Application Analytics** frequently after first deploying to Sevalla and periodically after that. If you see any unexplained analytics data or inconsistencies that concern you, [let our Support team know](/support/contact-support/), and we can further investigate to help determine the cause.