> ## Documentation Index
> Fetch the complete documentation index at: https://docs.sevalla.com/llms.txt
> Use this file to discover all available pages before exploring further.
> ## Agent Instructions
> These are the docs for Sevalla, a platform for deploying applications, databases, static sites, object storage and load balancers. The dashboard is at https://app.sevalla.com.
> Bold text in steps is an exact dashboard label.
> To act on a Sevalla account, prefer the Sevalla MCP server (https://mcp.sevalla.com/mcp, see https://docs.sevalla.com/ai-agents/overview.md), then the Sevalla CLI (https://docs.sevalla.com/developer-tools/cli.md), then the REST API (https://api-docs.sevalla.com, OpenAPI spec at https://api.sevalla.com/v3/openapi.json).
> Every page index is at https://docs.sevalla.com/llms.txt.
# Logs
> Read, search, filter, tail and download an application's runtime logs (what its processes print) and access logs (every HTTP request), by process, level, attribute and time range.
The **Logs** tab shows two kinds of logs for an application. Runtime logs are what its processes write to standard output and standard error. Access logs record every HTTP request to its domains, with the status, path, timing and visitor details. Build logs belong to each deployment; see [Deployments](/applications/deployments).
## Log types
| Log type | What it contains | Filters on the left |
| - | - | - |
| **Runtime logs** | Every line your web process, background workers, cron jobs and jobs print to `stdout` or `stderr`, with a level | **Level** and **Process** |
| **Access logs** | One line per HTTP request to the application's domains, recorded by Cloudflare: method, path, status code, response time, client IP, country, device and user agent | Attributes only |
Write logs to `stdout` and `stderr`, not to files: lines written to a file inside the instance don't appear here.
Lines reach the dashboard a short time after they're written; it can take up to 2 minutes.
## Read logs
In the sidebar, click **Applications**, then click the application. Click the **Logs** tab.
In the filters on the left, choose **Runtime logs** or **Access logs**.
For runtime logs, pick a **Level** and a **Process**, or keep **All levels** and **All processes**. Type in **Search logs…** to show only lines that contain the text, and pick a time range.
Above the lines, a chart shows how many lines were written over the time range: **Log volume** by level for runtime logs, **Status codes** by class (`2xx` to `5xx`) for access logs. When lines from more than one process are on screen, each line shows its process's name.
The levels are **Trace**, **Debug**, **Info**, **Warn**, **Error** and **Fatal**.
To see one process's logs from the application's **Overview** tab, click **Logs** on the process: the **Logs** tab opens filtered to it.
## Pick a time range
The time range picker offers **Last 1 hour** (the default), **Last 6 hours**, **Last 12 hours**, **Last 1 day**, **Last 2 days**, **Last 4 days**, **Last 7 days**, **Last 14 days** and **Last 30 days**. For a custom range, pick a start and an end date and time within the last 60 days.
## Follow logs live
With a preset range ("Last …"), new lines appear as they're written. Click **Pause** to stop the stream while you read, and **Resume** to continue. The stream pauses by itself after 200 updates, and when you scroll up, **Jump to latest** shows how many new lines arrived. The view keeps up to 20,000 lines; older ones drop off the top.
A custom range that ended in the past shows history only. If the stream drops, the status bar says **Live tail disconnected** and offers to reconnect.
## Filter by attribute
Every line carries attributes, such as the request fields of an access log line. Open a line to see the keys it has. To filter on them:
In **Attributes**, click **Add filter**.
Enter the **Key** (`message`, `severity`, or a path that starts with `attributes.` or `tags.`), pick an operator, and enter the **Value**.
Click **Run query**, or press Cmd+Enter (Ctrl+Enter on Windows and Linux).
| Operators |
| - |
| equals, does not equal, contains, does not contain, starts with, does not start with, ends with, does not end with, greater than or equals, less than or equals |
You can also filter from a line: open it, then use the filter or exclude buttons next to any attribute. Open a line by clicking it to see all its attributes, copy them with **Copy JSON**, or show the 1, 5 or 10 minutes **Around this line**.
## Copy and download logs
Click **⋯** (**Log actions**) above the lines:
| Action | What you get |
| - | - |
| **Refresh** | Reloads the lines for the current range |
| **Copy all lines** | The messages of the lines on screen, without colors, one per line |
| **Download as JSON** | A `logs-
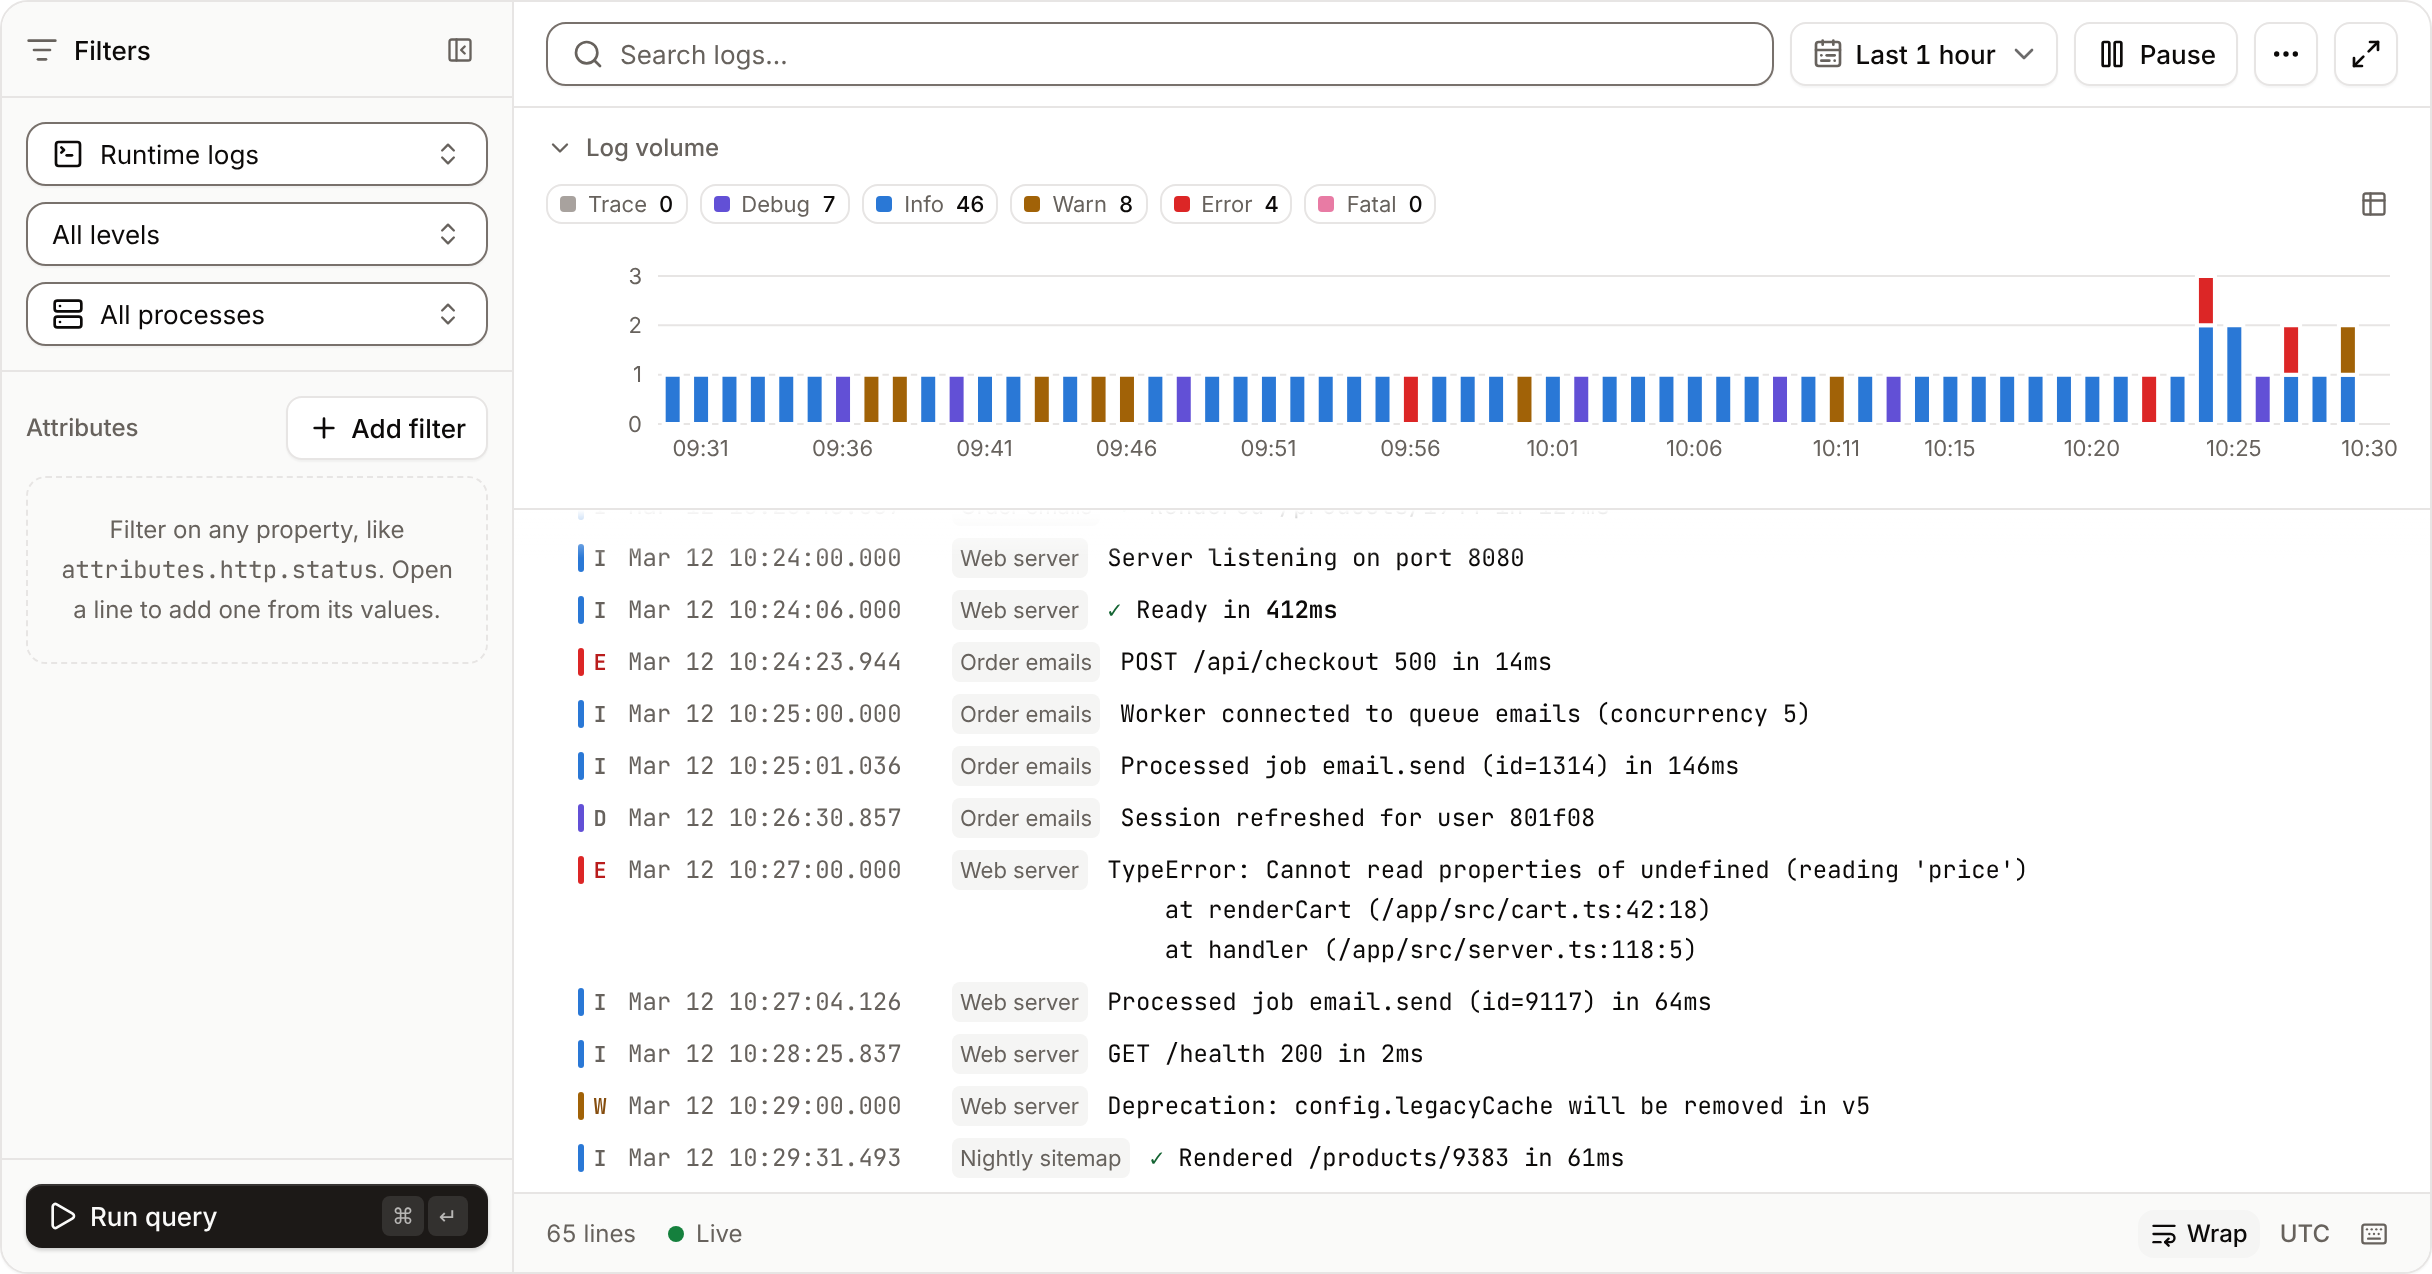
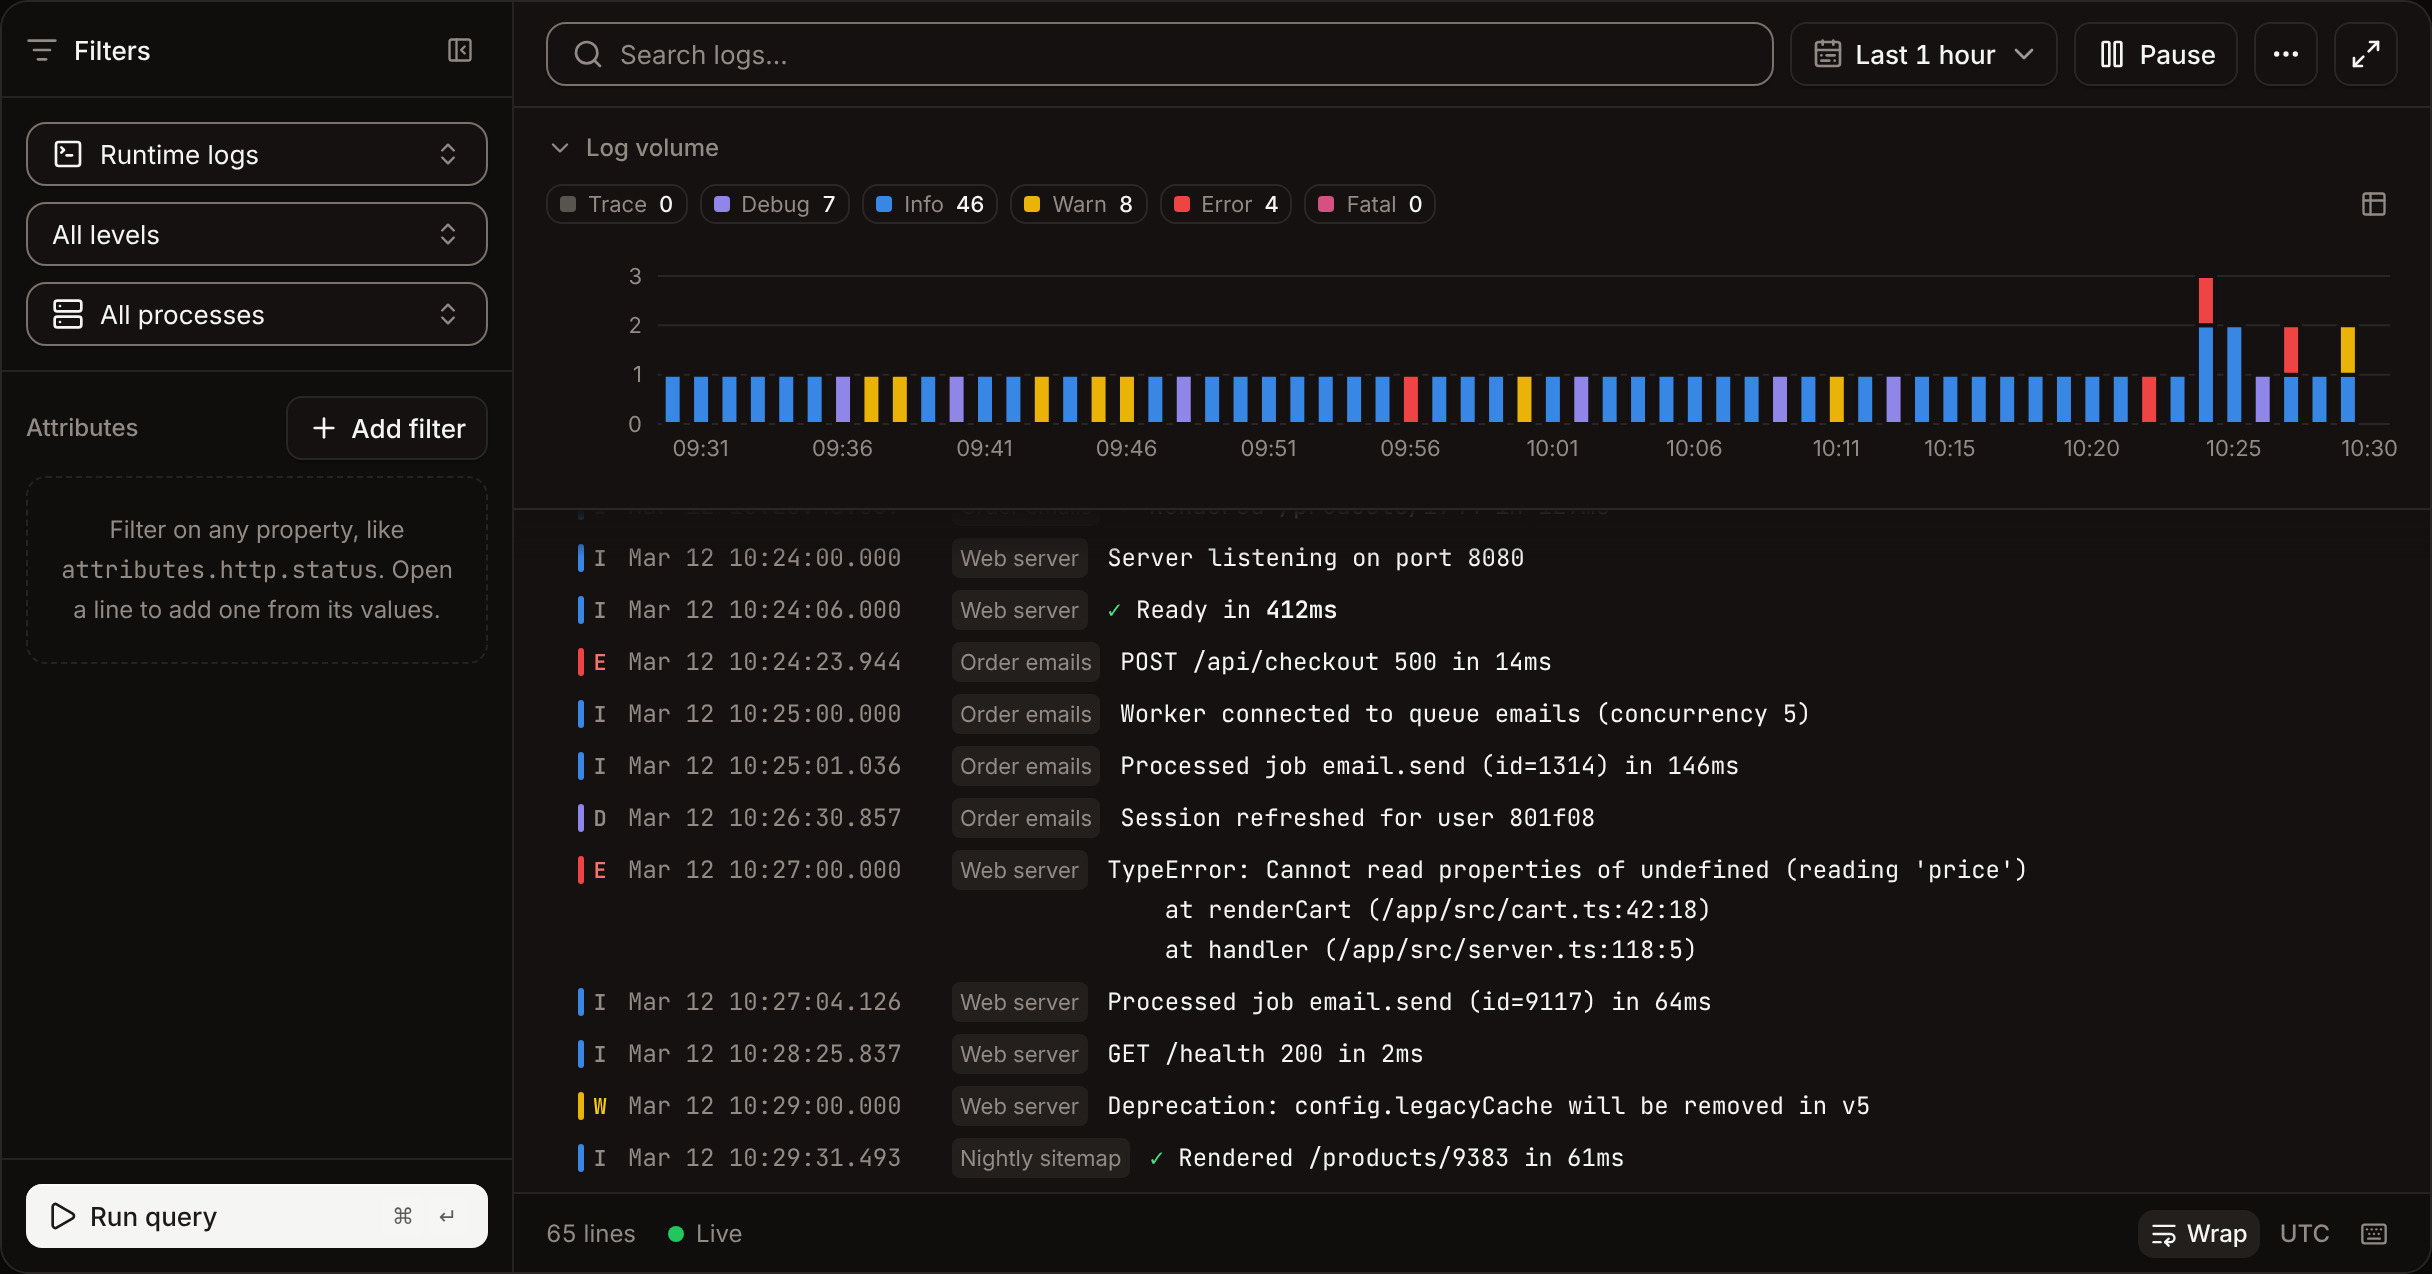 Above the lines, a chart shows how many lines were written over the time range: **Log volume** by level for runtime logs, **Status codes** by class (`2xx` to `5xx`) for access logs. When lines from more than one process are on screen, each line shows its process's name.
The levels are **Trace**, **Debug**, **Info**, **Warn**, **Error** and **Fatal**.
To see one process's logs from the application's **Overview** tab, click **Logs** on the process: the **Logs** tab opens filtered to it.
## Pick a time range
The time range picker offers **Last 1 hour** (the default), **Last 6 hours**, **Last 12 hours**, **Last 1 day**, **Last 2 days**, **Last 4 days**, **Last 7 days**, **Last 14 days** and **Last 30 days**. For a custom range, pick a start and an end date and time within the last 60 days.
## Follow logs live
With a preset range ("Last …"), new lines appear as they're written. Click **Pause** to stop the stream while you read, and **Resume** to continue. The stream pauses by itself after 200 updates, and when you scroll up, **Jump to latest** shows how many new lines arrived. The view keeps up to 20,000 lines; older ones drop off the top.
A custom range that ended in the past shows history only. If the stream drops, the status bar says **Live tail disconnected** and offers to reconnect.
## Filter by attribute
Every line carries attributes, such as the request fields of an access log line. Open a line to see the keys it has. To filter on them:
Above the lines, a chart shows how many lines were written over the time range: **Log volume** by level for runtime logs, **Status codes** by class (`2xx` to `5xx`) for access logs. When lines from more than one process are on screen, each line shows its process's name.
The levels are **Trace**, **Debug**, **Info**, **Warn**, **Error** and **Fatal**.
To see one process's logs from the application's **Overview** tab, click **Logs** on the process: the **Logs** tab opens filtered to it.
## Pick a time range
The time range picker offers **Last 1 hour** (the default), **Last 6 hours**, **Last 12 hours**, **Last 1 day**, **Last 2 days**, **Last 4 days**, **Last 7 days**, **Last 14 days** and **Last 30 days**. For a custom range, pick a start and an end date and time within the last 60 days.
## Follow logs live
With a preset range ("Last …"), new lines appear as they're written. Click **Pause** to stop the stream while you read, and **Resume** to continue. The stream pauses by itself after 200 updates, and when you scroll up, **Jump to latest** shows how many new lines arrived. The view keeps up to 20,000 lines; older ones drop off the top.
A custom range that ended in the past shows history only. If the stream drops, the status bar says **Live tail disconnected** and offers to reconnect.
## Filter by attribute
Every line carries attributes, such as the request fields of an access log line. Open a line to see the keys it has. To filter on them: