> ## Documentation Index
> Fetch the complete documentation index at: https://docs.sevalla.com/llms.txt
> Use this file to discover all available pages before exploring further.
> ## Agent Instructions
> These are the docs for Sevalla, a platform for deploying applications, databases, static sites, object storage and load balancers. The dashboard is at https://app.sevalla.com.
> Bold text in steps is an exact dashboard label.
> To act on a Sevalla account, prefer the Sevalla MCP server (https://mcp.sevalla.com/mcp, see https://docs.sevalla.com/ai-agents/overview.md), then the Sevalla CLI (https://docs.sevalla.com/developer-tools/cli.md), then the REST API (https://api-docs.sevalla.com, OpenAPI spec at https://api.sevalla.com/v3/openapi.json).
> Every page index is at https://docs.sevalla.com/llms.txt.
# Troubleshoot runtime errors
> Find why a running process crashes, restarts or can't reach its database: read App health and exit codes, and fix out-of-memory kills, start commands, health checks and PHP limits.
A runtime error happens after a deployment succeeds: a process crashes, restarts in a loop, runs out of memory or can't reach a service it needs. Sevalla restarts a web process or background worker that exits, and shows why it stopped in **App health**. This page explains how to read it and how to fix the common causes.
## Check the health of the application
When an instance crashes or exits with an error, a red banner appears at the top of every tab of the application, for example `The app exited with code 137 (OOMKilled, SIGKILL).` Click it (**See app health**) to open **App health**.
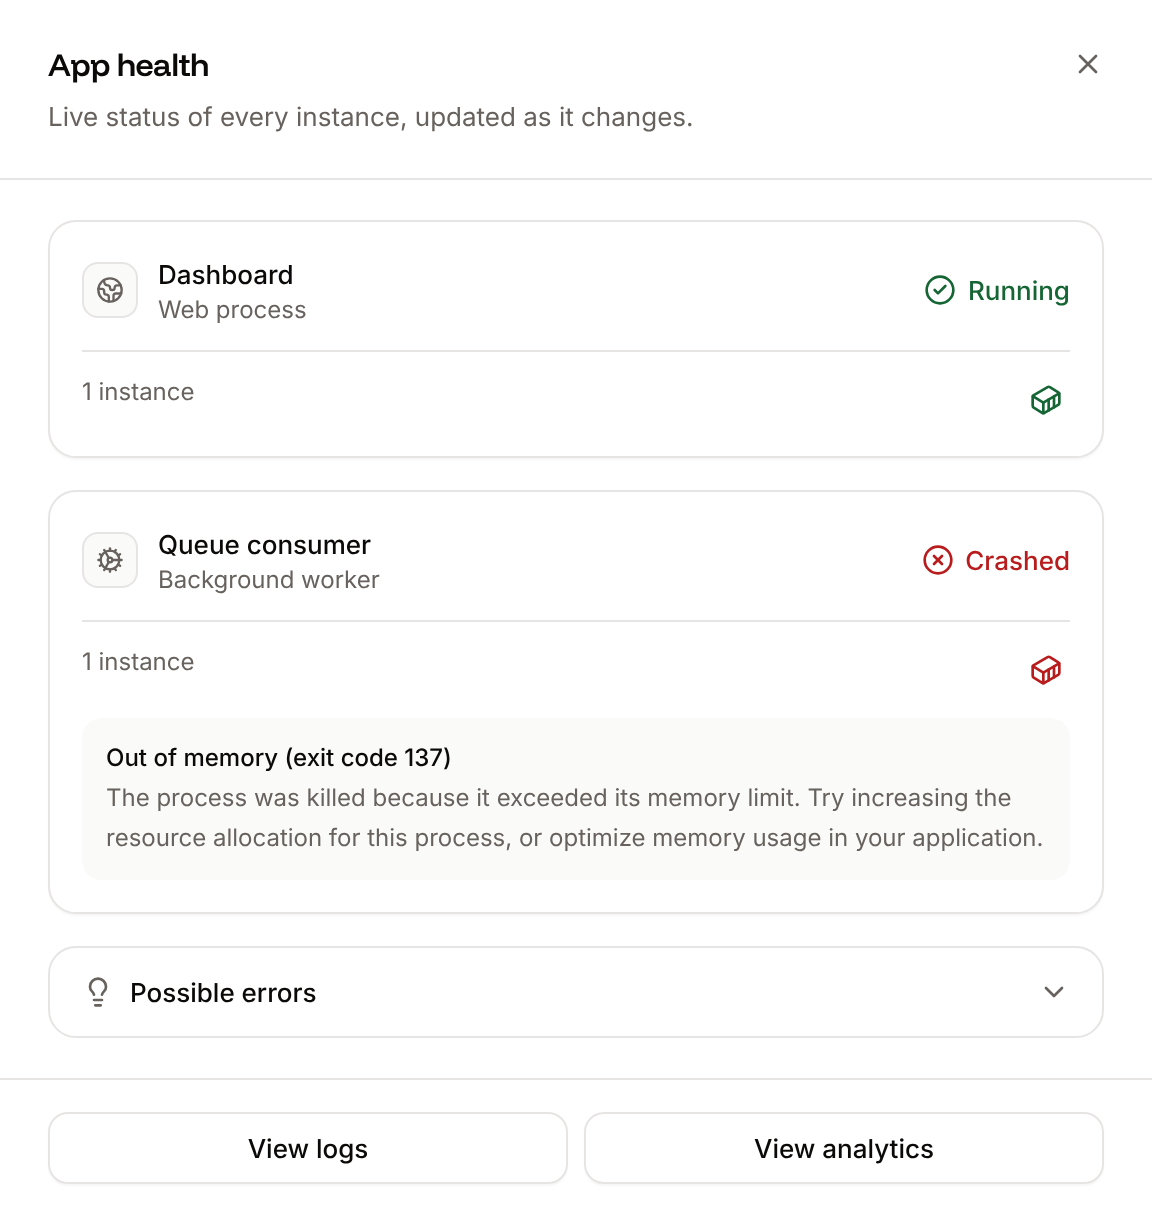
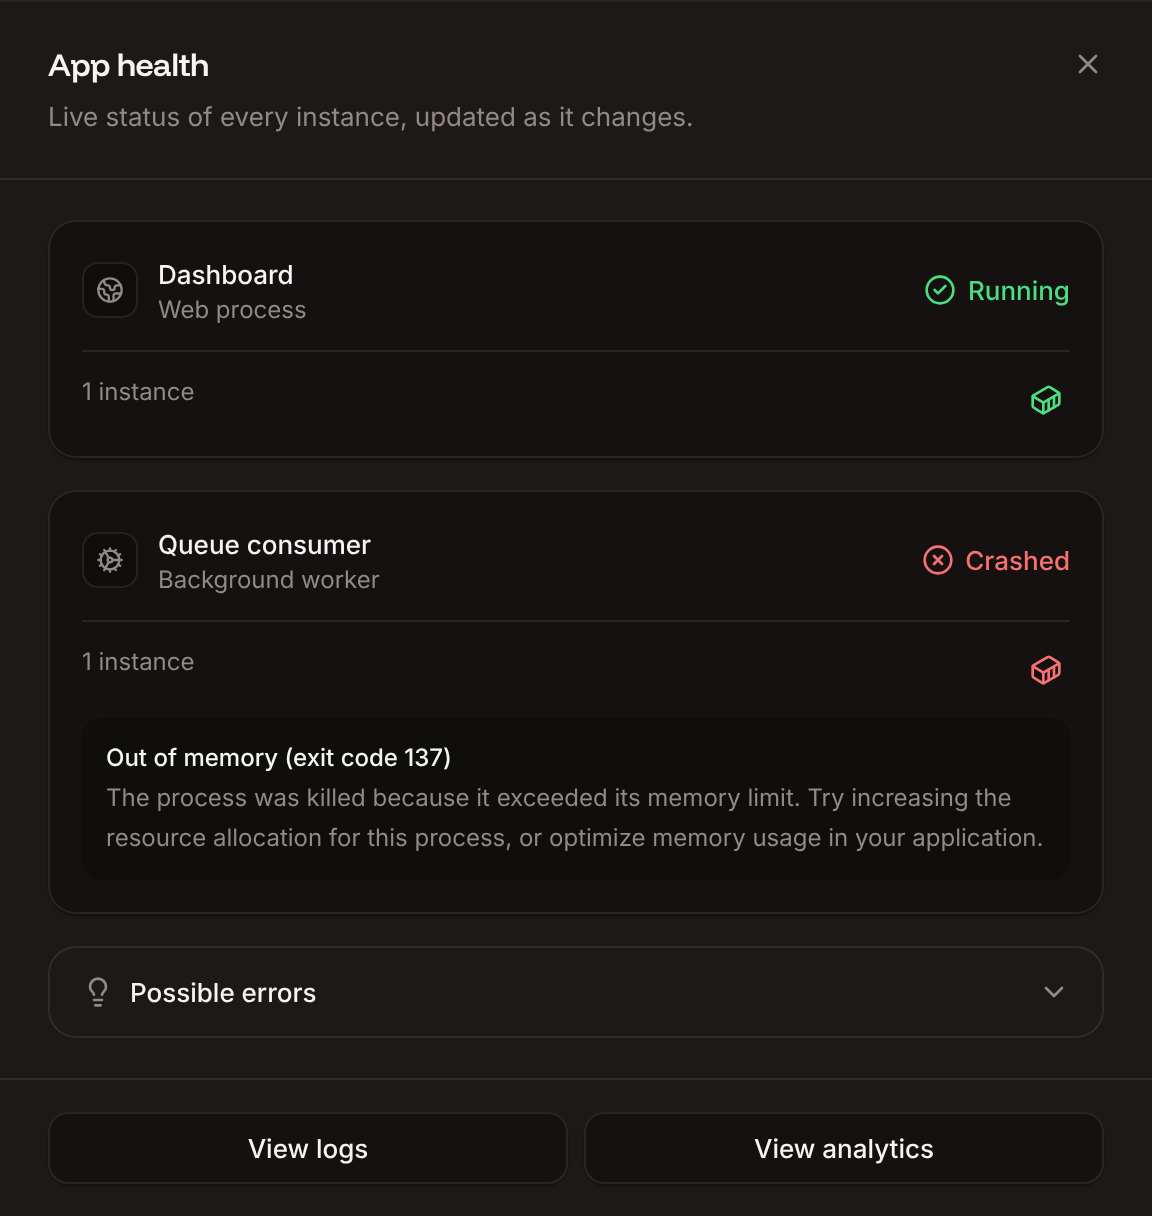 **App health** shows the live status of every process: **Running**, **Updating**, **Crashed**, or **Succeeded** for cron jobs and jobs. Each instance has an icon; point at it to see its status, when it was created, how many times it restarted, its exit code and a description. Under a failing process, Sevalla suggests the likely cause; **Possible errors** lists them all. **View logs** opens the [runtime logs](/applications/logs) and **View analytics** the [CPU and memory charts](/applications/analytics).
## What the exit code means
| Exit code | Meaning | What to do |
| - | - | - |
| `0` | The process exited without an error. Web processes and background workers must keep running | Make the start command launch a long-running server or worker, not a task that finishes. Run one-off tasks as a [job](/applications/processes#jobs) or [cron job](/applications/processes#cron-jobs) |
| `1` | An unhandled error in your code | Read the stack trace in the runtime logs and fix the error |
| `126` | The command exists but can't be executed | Make the script executable (`chmod +x`) in your build, or run it through its interpreter (`sh start.sh`) |
| `127` | Command not found | Check the start command for typos and that the program is installed in the image |
| `134` | The process aborted (`SIGABRT`) | Usually a failed assertion or a crash in native code. Check the logs right before the exit |
| `137` | Killed (`SIGKILL`), usually because it ran out of memory | See [The process runs out of memory](#the-process-runs-out-of-memory) |
| `139` | Segmentation fault (`SIGSEGV`) | A bug in native code or a native dependency built for another architecture. Rebuild native modules in the build, not on your computer |
| `143` | Stopped with `SIGTERM` | Normal during deployments and scale-downs. If it happens at other times, the instance was moved because of resource pressure |
The [Get process exit codes](https://api-docs.sevalla.com/v3/applications/get-process-exit-codes) API operation returns the same exit codes with their times.
## The process runs out of memory
**Symptom.** Instances restart with exit code `137`, and the **Memory usage** chart on the **Analytics** tab reaches the limit line (turn on **Show limit**).
**Cause.** The process used more memory than its [instance size](/applications/scaling#instance-sizes) allows, so it was killed. An instance that writes more than 20 GB to its ephemeral filesystem is also stopped.
**Fix.**
1. On the **Processes** tab, click **⋯** on the process, then **Update process**, and pick a size with more memory, such as one in the **Memory optimized** group.
2. Deploy the application.
3. If memory keeps growing until the kill, look for a leak. Tell your runtime how much memory it has, for example `node --max-old-space-size=768 server.js` on a 1 GB size.
Files that must exceed 20 GB belong on a [disk](/applications/disks) or in [object storage](/object-storage/overview).
## The process crashes without any logs
**Symptom.** Instances keep restarting, and the runtime logs stay empty.
**Cause.** The start command fails before your code prints anything: the binary doesn't exist, the path is wrong, or the command exits at once.
**Fix.** Check the **Custom start command** on the process. When you chain commands, the last one must start the long-running server, for example `npm run migrate && npm start`. Leave the field empty to use the image's default command. To investigate inside the container, [debug the process in the web terminal](#debug-a-process-in-the-web-terminal).
## Health checks restart the process
**Symptom.** The web process restarts every few minutes, or a deployment fails, although the logs show no error.
**Cause.** A [liveness or readiness probe](/applications/processes#health-checks) fails: its path doesn't exist or returns an error, it uses the wrong port, or the application answers more slowly than the probe's **Timeout** (1 second by default), especially while it starts.
**Fix.** Open the web process with **Update process** and check the probe's **Path** and **Port**. Raise **Initial delay** above your application's startup time and **Timeout** above its normal response time. Point probes at a lightweight endpoint that doesn't call your database.
## The application cannot connect to a database
**Symptom.** The logs show connection errors such as `ECONNREFUSED`, `ETIMEDOUT`, `getaddrinfo ENOTFOUND`, `could not translate host name`, `password authentication failed` or `Access denied for user`.
**Cause.**
* There's no [internal connection](/applications/networking#internal-connections) between the application and the database, so the private network between them is closed.
* The application and the database are in different locations. Internal connections only work within one location.
* The application uses a wrong host: `localhost`, the database's external hostname, or an old value.
* The variable names don't match what the application reads, or the credentials changed.
* The database is suspended or still being created.
**Fix.**
1. On the application's **Networking** tab, check that the database is listed in **Connected services**. If not, add an internal connection and turn on **Add environment variables to the application**.
2. Check that the application reads the variables the connection added (`DB_HOST`, `DB_PORT`, `DB_DATABASE`, `DB_USERNAME`, `DB_PASSWORD` or `DB_URL`; `REDIS_URL` for Redis and Valkey), or rename them to what your framework expects.
3. Compare the values with the database's details; see [Connect to a database](/databases/connect).
4. Deploy the application, then check the connection with `printenv` and a client in the [web terminal](/applications/web-terminal).
If the application and the database are in different locations, clone the application into the database's location. See [Applications](/applications/overview).
## Connections to external services fail
**Symptom.** Calls to an external database, API or mail server time out or are refused.
**Cause.** The service only accepts known IP addresses, or the connection uses a blocked port. Outbound SMTP on ports 25, 465 and 587 is blocked (and 2525 in Oracle Cloud locations).
**Fix.** Allowlist the application's [egress IP addresses](/applications/networking#egress-ip-addresses) on the service. Send email through your provider's HTTP API instead of SMTP on a blocked port.
## PHP errors
These settings apply to PHP applications built with [Buildpacks](/applications/builds/buildpacks) (`heroku/php`). Put `.user.ini` and other configuration files in the application's root folder, push, and deploy.
### Allowed memory size exhausted
**Symptom.** The logs show `PHP Fatal error: Allowed memory size of 134217728 bytes exhausted`.
**Cause.** PHP's `memory_limit` is 128 MB by default.
**Fix.** Raise it in a `.user.ini` file. Keep it below the process's memory size, or the process is killed with exit code `137`.
```ini .user.ini theme={null}
memory_limit = 256M
```
### Scripts stop before they finish
**Symptom.** Long PHP requests stop with `Maximum execution time of 30 seconds exceeded`, or are cut off without an error.
**Cause.** PHP's `max_execution_time` or PHP-FPM's `request_terminate_timeout` ends the script.
**Fix.** Raise `max_execution_time` in `.user.ini`. Set `request_terminate_timeout` at least as high in an `fpm_custom.conf` file, and load it in the web process's start command. Neither can usefully exceed Cloudflare's 185-second limit; see [504 Gateway Timeout and Cloudflare error 524](/applications/troubleshooting/http-errors#504-gateway-timeout-and-cloudflare-error-524).
```ini .user.ini theme={null}
max_execution_time = 120
```
```ini fpm_custom.conf theme={null}
request_terminate_timeout = 120
```
```bash Start command theme={null}
heroku-php-apache2 -F fpm_custom.conf public/
```
## Debug a process in the web terminal
When a process crashes too fast to inspect, keep its container running and start your application by hand:
On the **Processes** tab, click **⋯** on the process, then **Update process**, and set **Custom start command** to `sleep infinity`. Note the old command first.
Deploy the application. The process now starts and waits without running your code.
Open the [web terminal](/applications/web-terminal) on the process. Run `printenv` to check the environment variables, then run your start command by hand, with debug output on, to see the error.
Put the original start command back and deploy again.
While the process sleeps, it doesn't serve traffic. If the web process has health checks, turn them off for the session, or they restart it.
If you're still stuck, [contact support](/support/get-help) with the application's name, the process and the time of the error.
This documentation is built and hosted on [Mintlify](https://mintlify.com), a developer documentation platform.
**App health** shows the live status of every process: **Running**, **Updating**, **Crashed**, or **Succeeded** for cron jobs and jobs. Each instance has an icon; point at it to see its status, when it was created, how many times it restarted, its exit code and a description. Under a failing process, Sevalla suggests the likely cause; **Possible errors** lists them all. **View logs** opens the [runtime logs](/applications/logs) and **View analytics** the [CPU and memory charts](/applications/analytics).
## What the exit code means
| Exit code | Meaning | What to do |
| - | - | - |
| `0` | The process exited without an error. Web processes and background workers must keep running | Make the start command launch a long-running server or worker, not a task that finishes. Run one-off tasks as a [job](/applications/processes#jobs) or [cron job](/applications/processes#cron-jobs) |
| `1` | An unhandled error in your code | Read the stack trace in the runtime logs and fix the error |
| `126` | The command exists but can't be executed | Make the script executable (`chmod +x`) in your build, or run it through its interpreter (`sh start.sh`) |
| `127` | Command not found | Check the start command for typos and that the program is installed in the image |
| `134` | The process aborted (`SIGABRT`) | Usually a failed assertion or a crash in native code. Check the logs right before the exit |
| `137` | Killed (`SIGKILL`), usually because it ran out of memory | See [The process runs out of memory](#the-process-runs-out-of-memory) |
| `139` | Segmentation fault (`SIGSEGV`) | A bug in native code or a native dependency built for another architecture. Rebuild native modules in the build, not on your computer |
| `143` | Stopped with `SIGTERM` | Normal during deployments and scale-downs. If it happens at other times, the instance was moved because of resource pressure |
The [Get process exit codes](https://api-docs.sevalla.com/v3/applications/get-process-exit-codes) API operation returns the same exit codes with their times.
## The process runs out of memory
**Symptom.** Instances restart with exit code `137`, and the **Memory usage** chart on the **Analytics** tab reaches the limit line (turn on **Show limit**).
**Cause.** The process used more memory than its [instance size](/applications/scaling#instance-sizes) allows, so it was killed. An instance that writes more than 20 GB to its ephemeral filesystem is also stopped.
**Fix.**
1. On the **Processes** tab, click **⋯** on the process, then **Update process**, and pick a size with more memory, such as one in the **Memory optimized** group.
2. Deploy the application.
3. If memory keeps growing until the kill, look for a leak. Tell your runtime how much memory it has, for example `node --max-old-space-size=768 server.js` on a 1 GB size.
Files that must exceed 20 GB belong on a [disk](/applications/disks) or in [object storage](/object-storage/overview).
## The process crashes without any logs
**Symptom.** Instances keep restarting, and the runtime logs stay empty.
**Cause.** The start command fails before your code prints anything: the binary doesn't exist, the path is wrong, or the command exits at once.
**Fix.** Check the **Custom start command** on the process. When you chain commands, the last one must start the long-running server, for example `npm run migrate && npm start`. Leave the field empty to use the image's default command. To investigate inside the container, [debug the process in the web terminal](#debug-a-process-in-the-web-terminal).
## Health checks restart the process
**Symptom.** The web process restarts every few minutes, or a deployment fails, although the logs show no error.
**Cause.** A [liveness or readiness probe](/applications/processes#health-checks) fails: its path doesn't exist or returns an error, it uses the wrong port, or the application answers more slowly than the probe's **Timeout** (1 second by default), especially while it starts.
**Fix.** Open the web process with **Update process** and check the probe's **Path** and **Port**. Raise **Initial delay** above your application's startup time and **Timeout** above its normal response time. Point probes at a lightweight endpoint that doesn't call your database.
## The application cannot connect to a database
**Symptom.** The logs show connection errors such as `ECONNREFUSED`, `ETIMEDOUT`, `getaddrinfo ENOTFOUND`, `could not translate host name`, `password authentication failed` or `Access denied for user`.
**Cause.**
* There's no [internal connection](/applications/networking#internal-connections) between the application and the database, so the private network between them is closed.
* The application and the database are in different locations. Internal connections only work within one location.
* The application uses a wrong host: `localhost`, the database's external hostname, or an old value.
* The variable names don't match what the application reads, or the credentials changed.
* The database is suspended or still being created.
**Fix.**
1. On the application's **Networking** tab, check that the database is listed in **Connected services**. If not, add an internal connection and turn on **Add environment variables to the application**.
2. Check that the application reads the variables the connection added (`DB_HOST`, `DB_PORT`, `DB_DATABASE`, `DB_USERNAME`, `DB_PASSWORD` or `DB_URL`; `REDIS_URL` for Redis and Valkey), or rename them to what your framework expects.
3. Compare the values with the database's details; see [Connect to a database](/databases/connect).
4. Deploy the application, then check the connection with `printenv` and a client in the [web terminal](/applications/web-terminal).
If the application and the database are in different locations, clone the application into the database's location. See [Applications](/applications/overview).
## Connections to external services fail
**Symptom.** Calls to an external database, API or mail server time out or are refused.
**Cause.** The service only accepts known IP addresses, or the connection uses a blocked port. Outbound SMTP on ports 25, 465 and 587 is blocked (and 2525 in Oracle Cloud locations).
**Fix.** Allowlist the application's [egress IP addresses](/applications/networking#egress-ip-addresses) on the service. Send email through your provider's HTTP API instead of SMTP on a blocked port.
## PHP errors
These settings apply to PHP applications built with [Buildpacks](/applications/builds/buildpacks) (`heroku/php`). Put `.user.ini` and other configuration files in the application's root folder, push, and deploy.
### Allowed memory size exhausted
**Symptom.** The logs show `PHP Fatal error: Allowed memory size of 134217728 bytes exhausted`.
**Cause.** PHP's `memory_limit` is 128 MB by default.
**Fix.** Raise it in a `.user.ini` file. Keep it below the process's memory size, or the process is killed with exit code `137`.
```ini .user.ini theme={null}
memory_limit = 256M
```
### Scripts stop before they finish
**Symptom.** Long PHP requests stop with `Maximum execution time of 30 seconds exceeded`, or are cut off without an error.
**Cause.** PHP's `max_execution_time` or PHP-FPM's `request_terminate_timeout` ends the script.
**Fix.** Raise `max_execution_time` in `.user.ini`. Set `request_terminate_timeout` at least as high in an `fpm_custom.conf` file, and load it in the web process's start command. Neither can usefully exceed Cloudflare's 185-second limit; see [504 Gateway Timeout and Cloudflare error 524](/applications/troubleshooting/http-errors#504-gateway-timeout-and-cloudflare-error-524).
```ini .user.ini theme={null}
max_execution_time = 120
```
```ini fpm_custom.conf theme={null}
request_terminate_timeout = 120
```
```bash Start command theme={null}
heroku-php-apache2 -F fpm_custom.conf public/
```
## Debug a process in the web terminal
When a process crashes too fast to inspect, keep its container running and start your application by hand:
On the **Processes** tab, click **⋯** on the process, then **Update process**, and set **Custom start command** to `sleep infinity`. Note the old command first.
Deploy the application. The process now starts and waits without running your code.
Open the [web terminal](/applications/web-terminal) on the process. Run `printenv` to check the environment variables, then run your start command by hand, with debug output on, to see the error.
Put the original start command back and deploy again.
While the process sleeps, it doesn't serve traffic. If the web process has health checks, turn them off for the session, or they restart it.
If you're still stuck, [contact support](/support/get-help) with the application's name, the process and the time of the error.
This documentation is built and hosted on [Mintlify](https://mintlify.com), a developer documentation platform.