> ## Documentation Index
> Fetch the complete documentation index at: https://docs.sevalla.com/llms.txt
> Use this file to discover all available pages before exploring further.
# Usage
> View a clear breakdown of spending across all of your services.
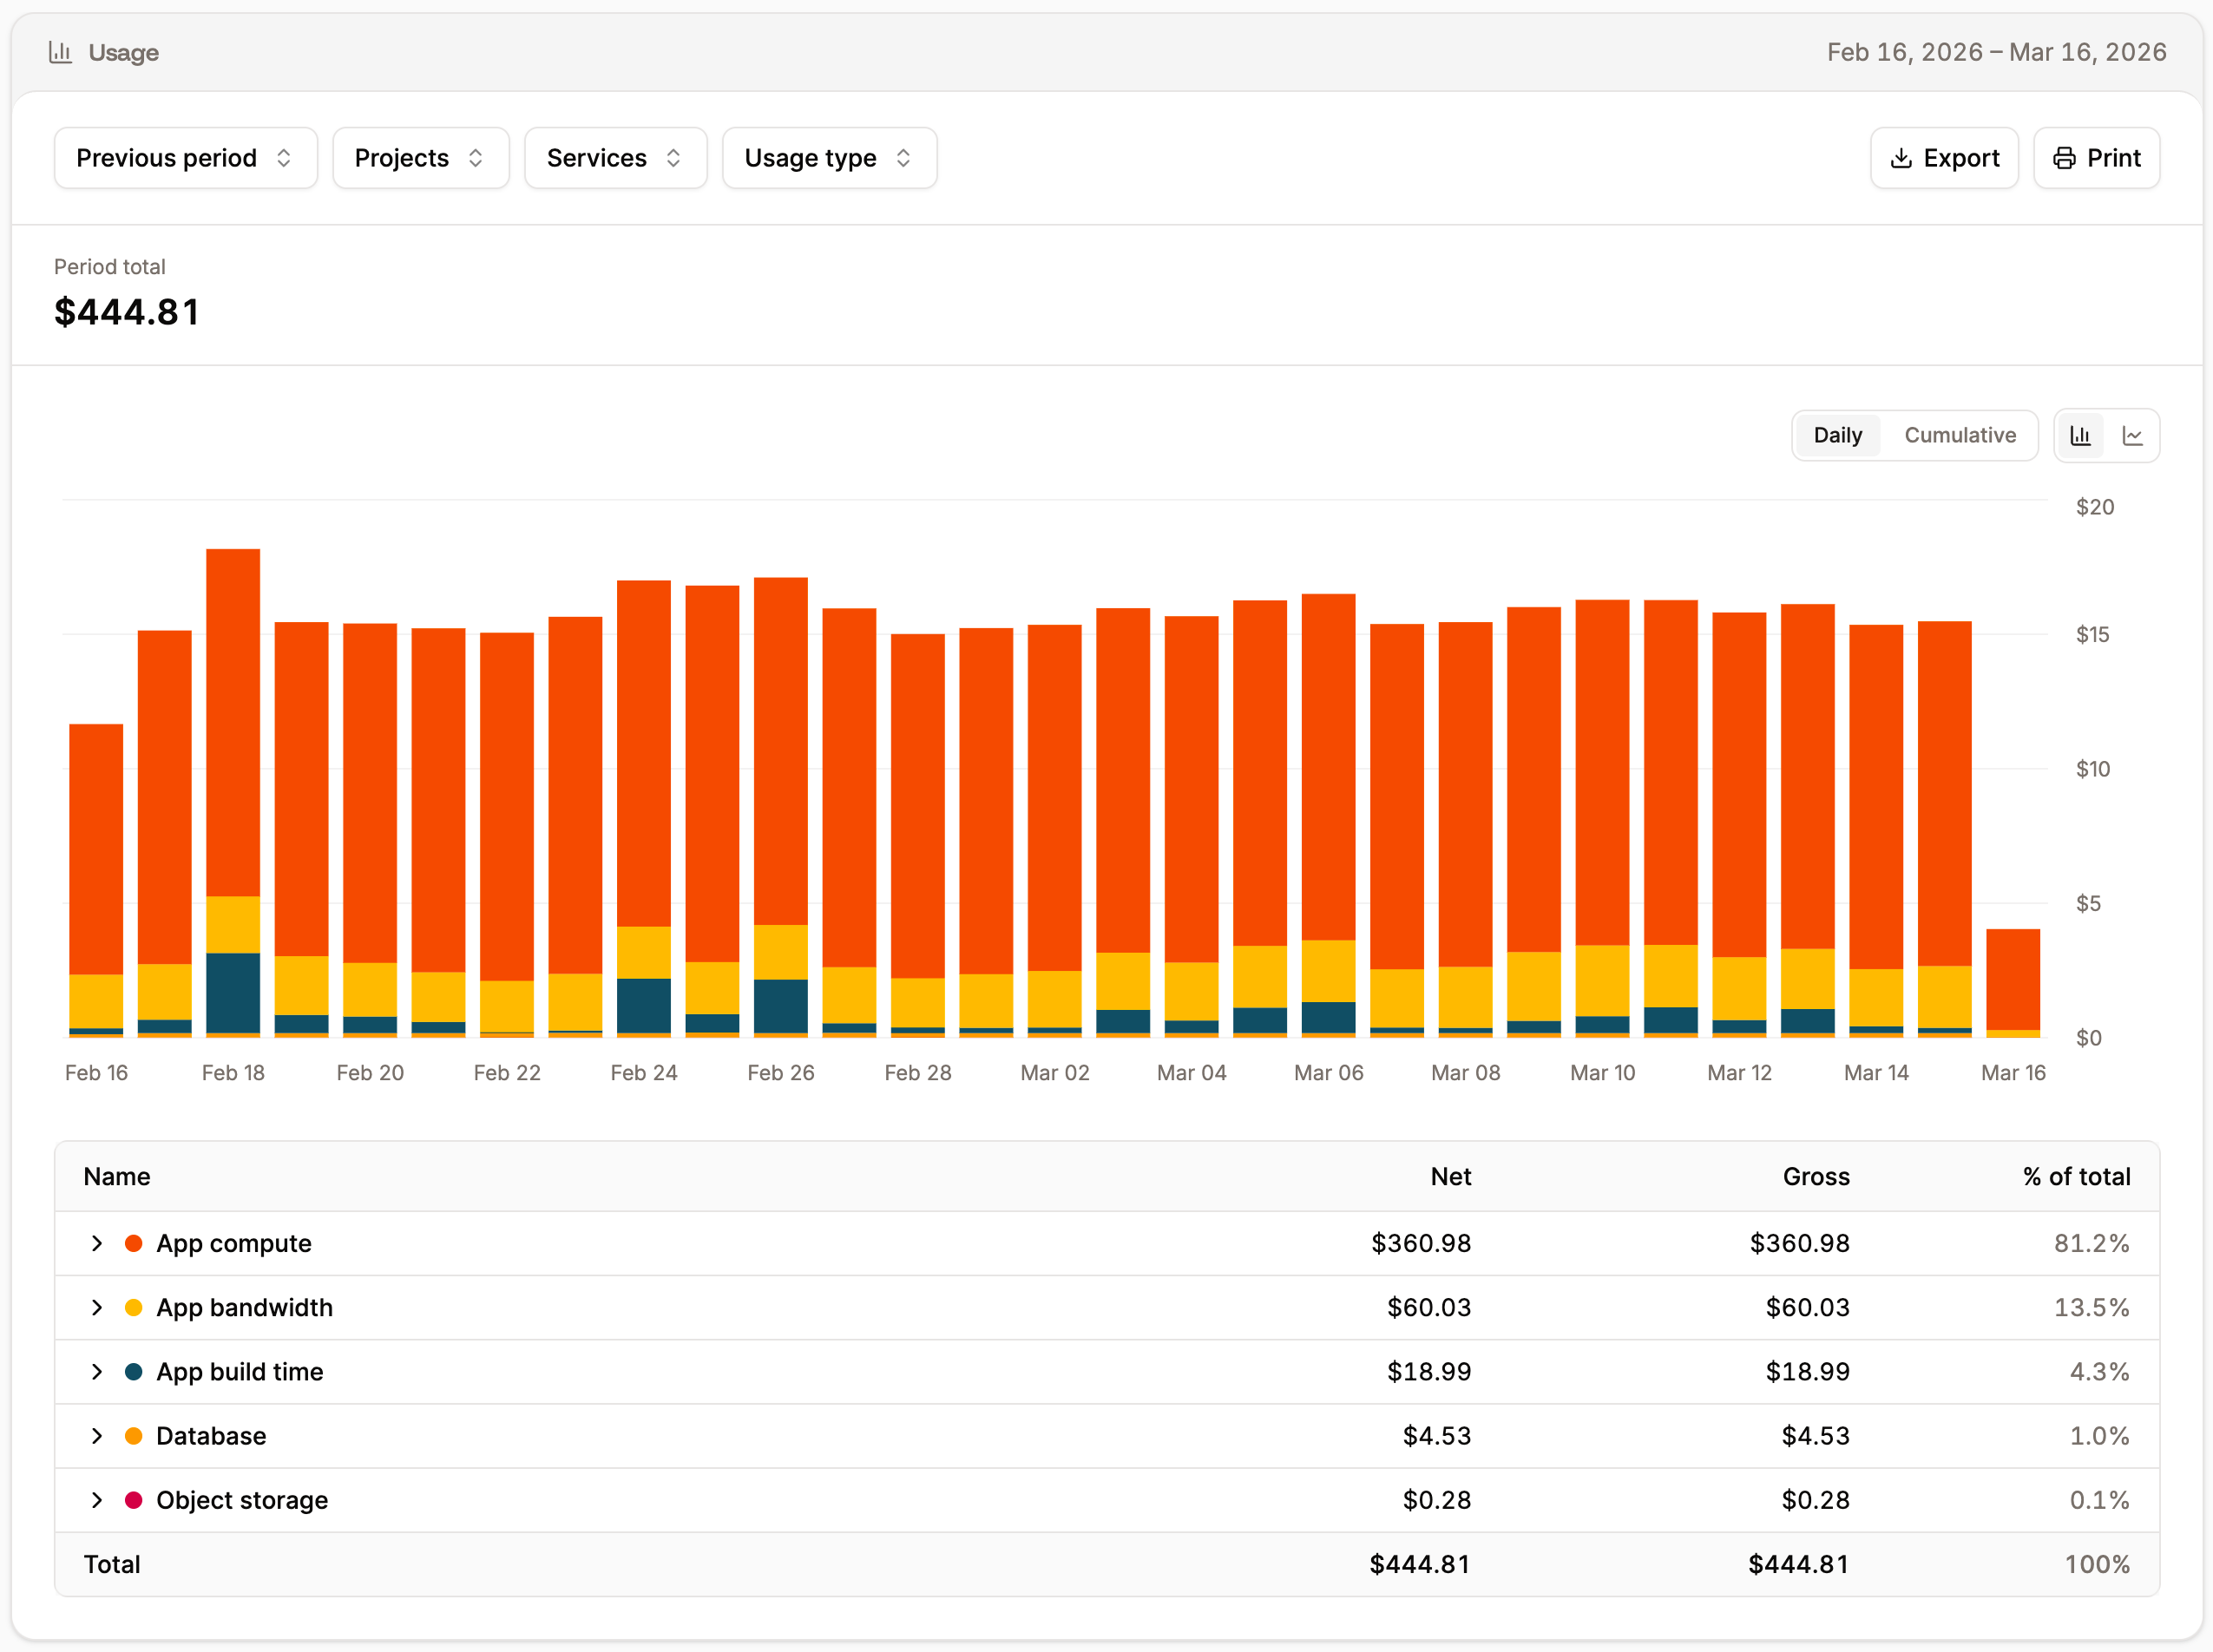
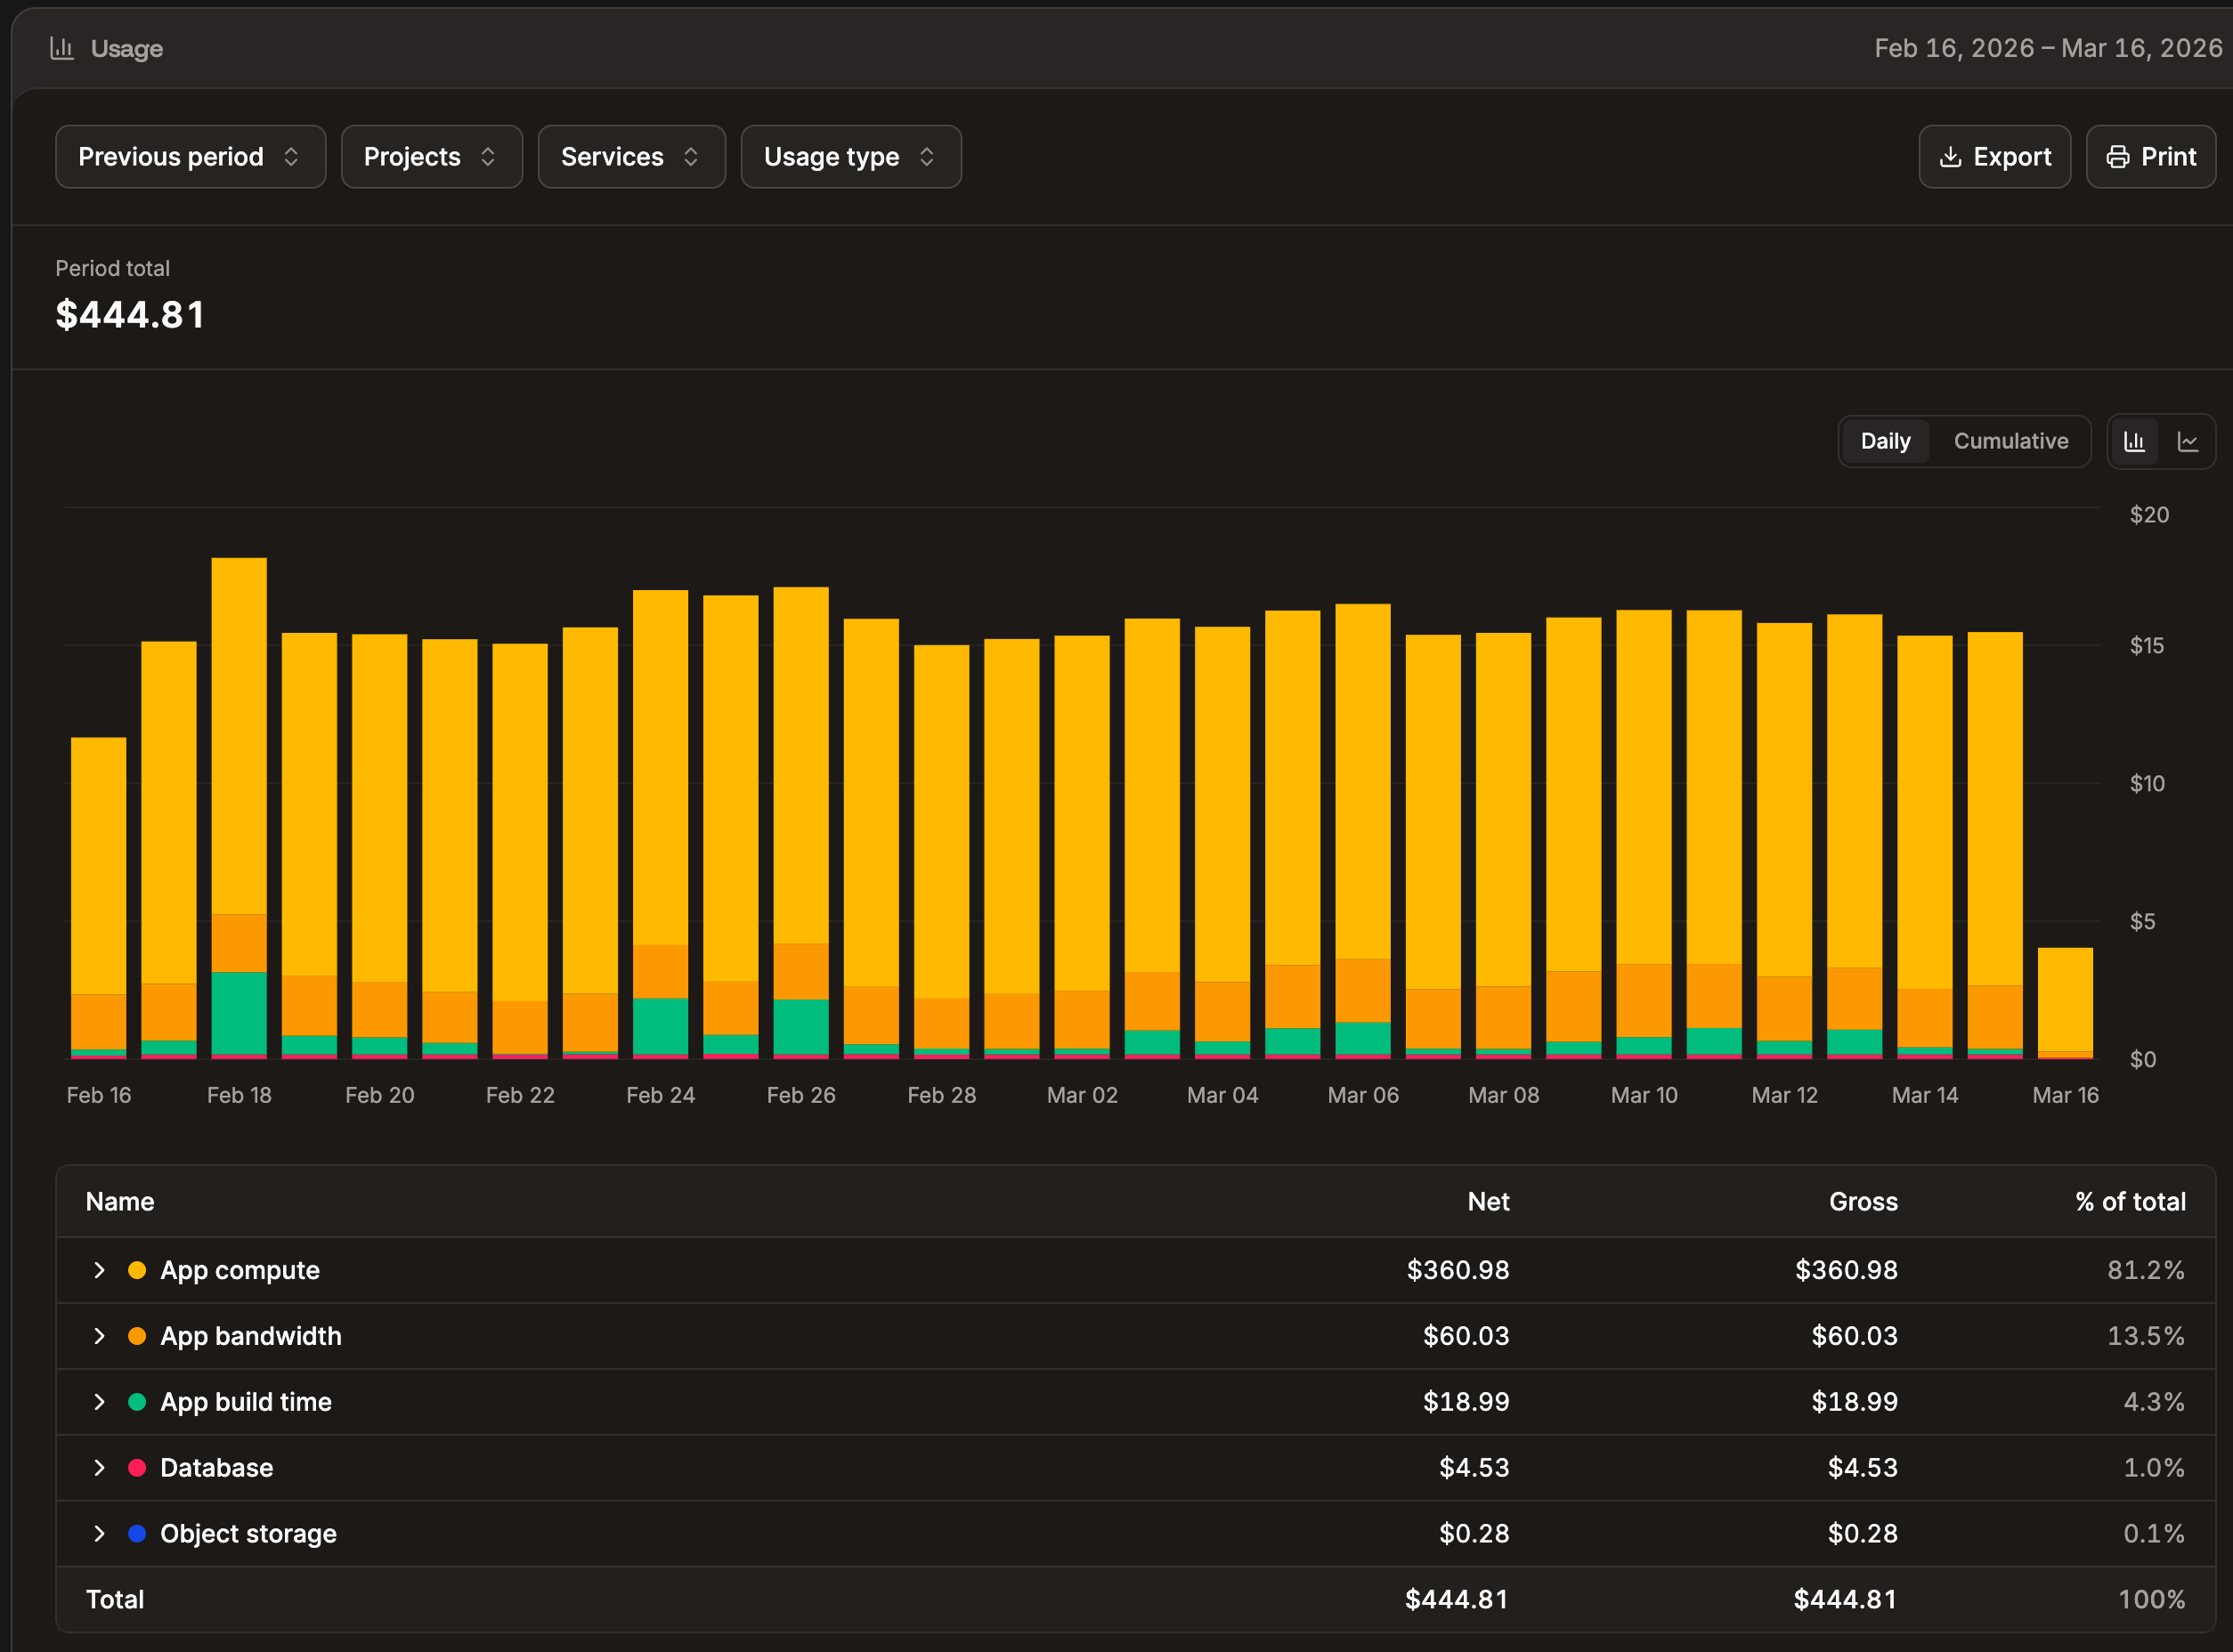
The **Usage** page provides complete visibility into your resource consumption and costs for both the current and previous billing periods across all your services, including:
* Applications
* Databases
* Static sites
* Object storage
* Load balancers
You can view the total usage for the current and previous billing periods, see a projected cost for the end of the current period, and compare the two periods with a percentage change to understand how your usage is trending.
The usage chart can be filtered by project, service, or usage type, allowing you to focus on specific costs. You can also drill down into each usage category to view a detailed breakdown by service, including services that have since been deleted.
For further analysis or reporting, you can export the usage data as CSV or JSON, or print it directly from Sevalla.
You can access the **Usage** page within **Company settings**.