> ## Documentation Index
> Fetch the complete documentation index at: https://docs.sevalla.com/llms.txt
> Use this file to discover all available pages before exploring further.
# Databases - Analytics
> Monitor your database performance and analytics in real time.
Sevalla charges for [Database Hosting](https://sevalla.com/database-hosting/) based on the size, runtime, and egress bandwidth (when applicable) of your database. With Database Analytics, you can get insights into your database's usage data. You can view analytics for each database in database-level analytics or for all of your databases in company-level analytics. For more information about how your usage is calculated and how it appears on your invoice, refer to [Database Pricing](/billing/database-pricing).
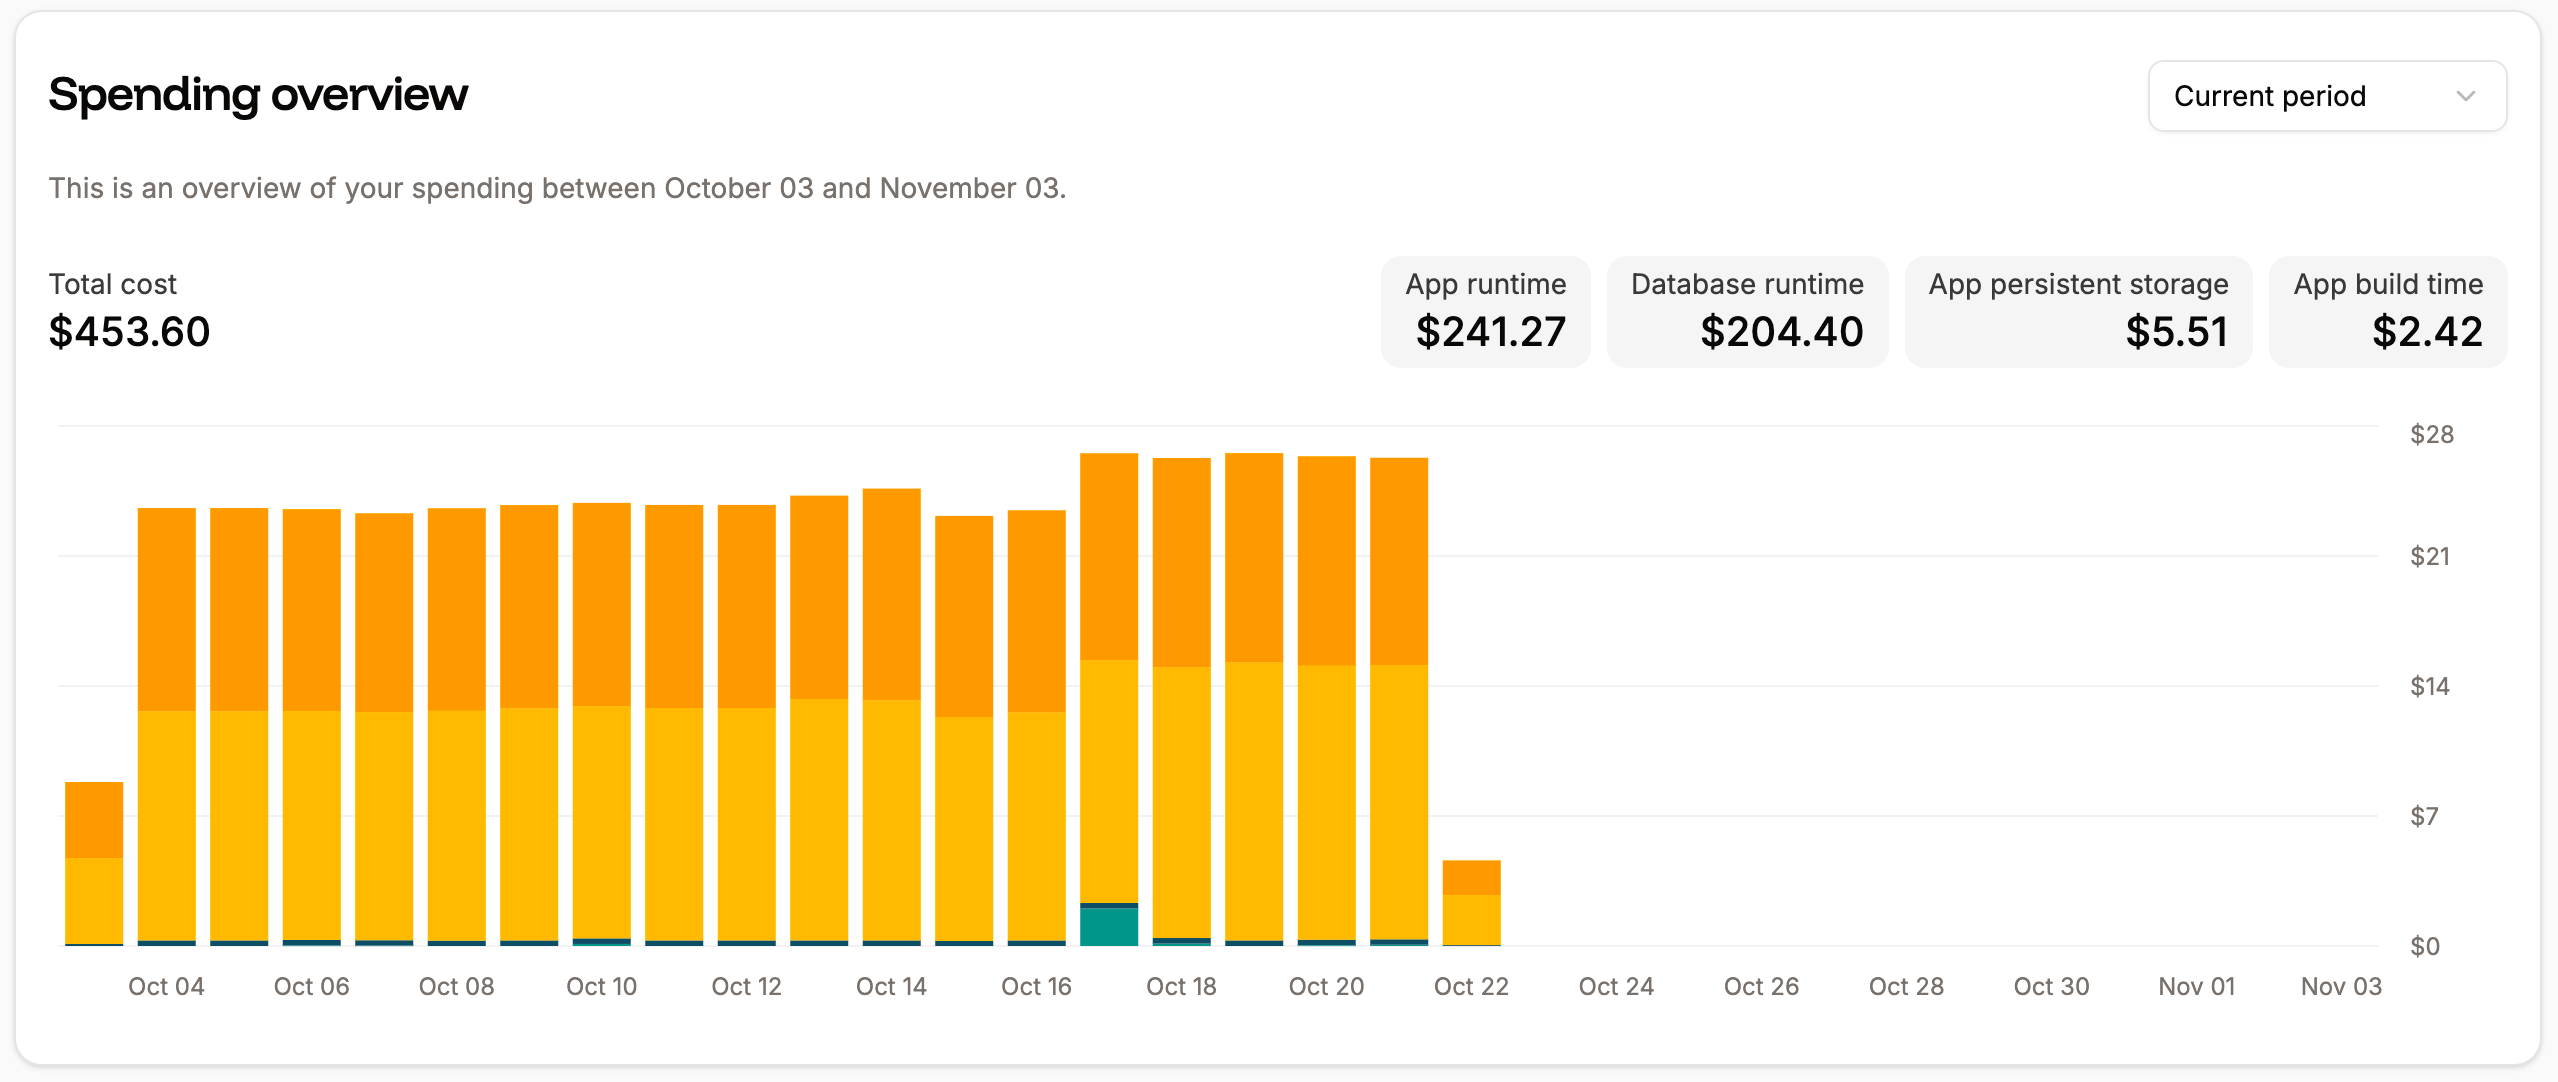
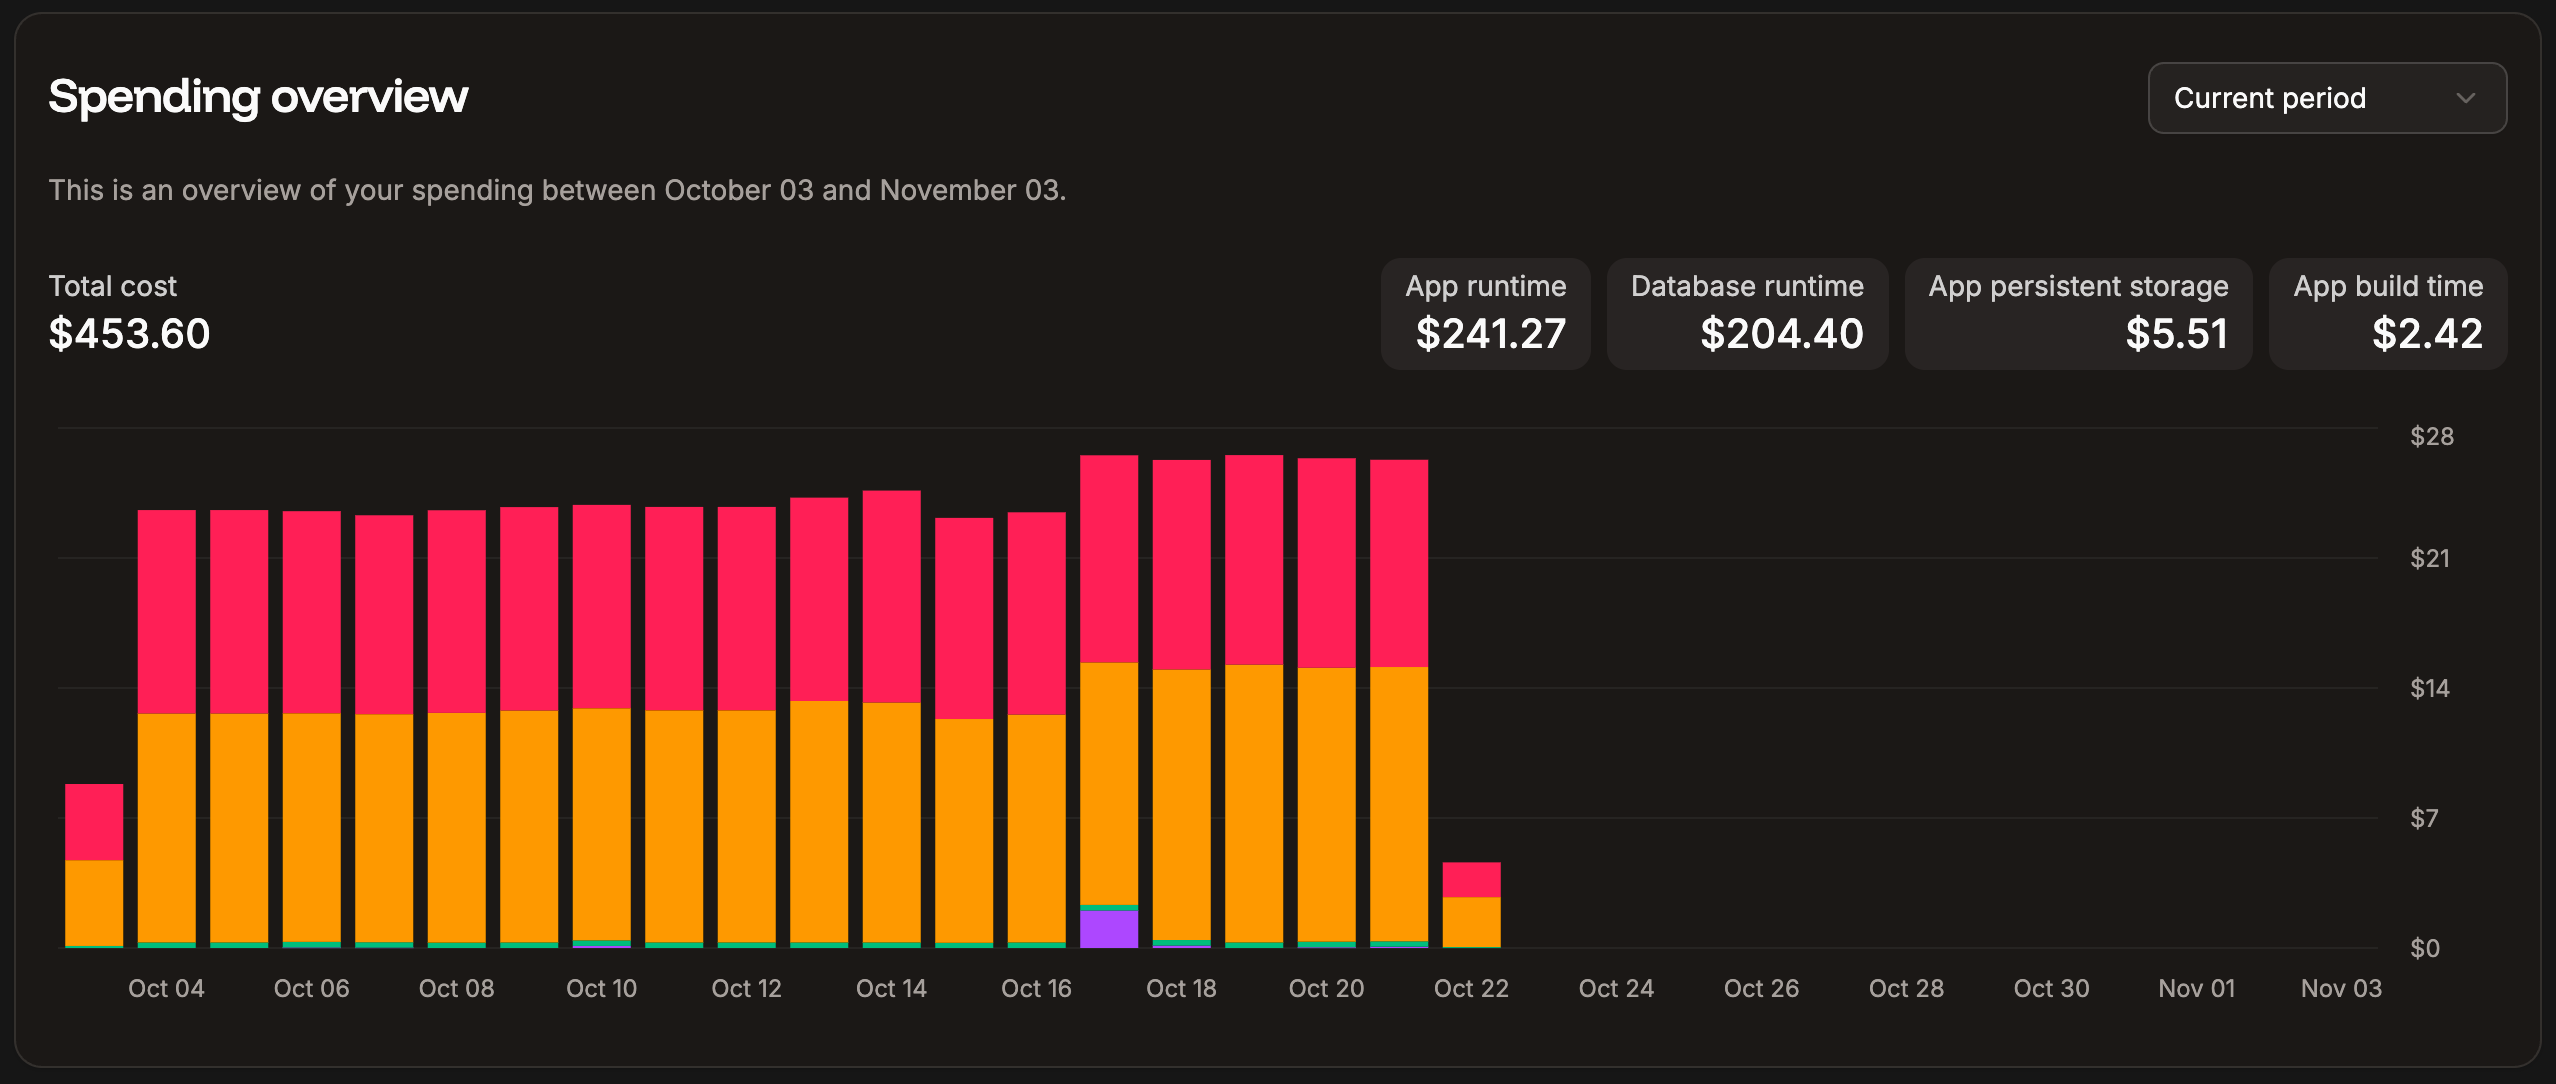
The database billing amounts are also included in the **Spending overview** chart on your Sevalla Dashboard. This chart shows the spending overview for all Sevalla services.
 ## Database analytics
Database analytics shows you information about your database's storage, memory, and CPU usage.
When viewing the database analytics, you can choose to see data for the past 1 hour, 6 hours, 12 hours, 1 day, 2 days, 4 days, 7 days, 14 days, or 30 days, or select a specific date and time period. You can refresh the chart data at any time.
When you hover over a chart, a corresponding reference line appears on the other charts on the same page. You can click and drag this reference line to zoom into a specific time period, and all charts on the page will update to show that same time range.
Select **Show limit** to compare your usage with your current plan limit.
To access these in-depth reports, go to your database's **Analytics** page (**Databases** > ***dbname*** > **Analytics**).
## Database analytics
Database analytics shows you information about your database's storage, memory, and CPU usage.
When viewing the database analytics, you can choose to see data for the past 1 hour, 6 hours, 12 hours, 1 day, 2 days, 4 days, 7 days, 14 days, or 30 days, or select a specific date and time period. You can refresh the chart data at any time.
When you hover over a chart, a corresponding reference line appears on the other charts on the same page. You can click and drag this reference line to zoom into a specific time period, and all charts on the page will update to show that same time range.
Select **Show limit** to compare your usage with your current plan limit.
To access these in-depth reports, go to your database's **Analytics** page (**Databases** > ***dbname*** > **Analytics**).
 ### Storage usage
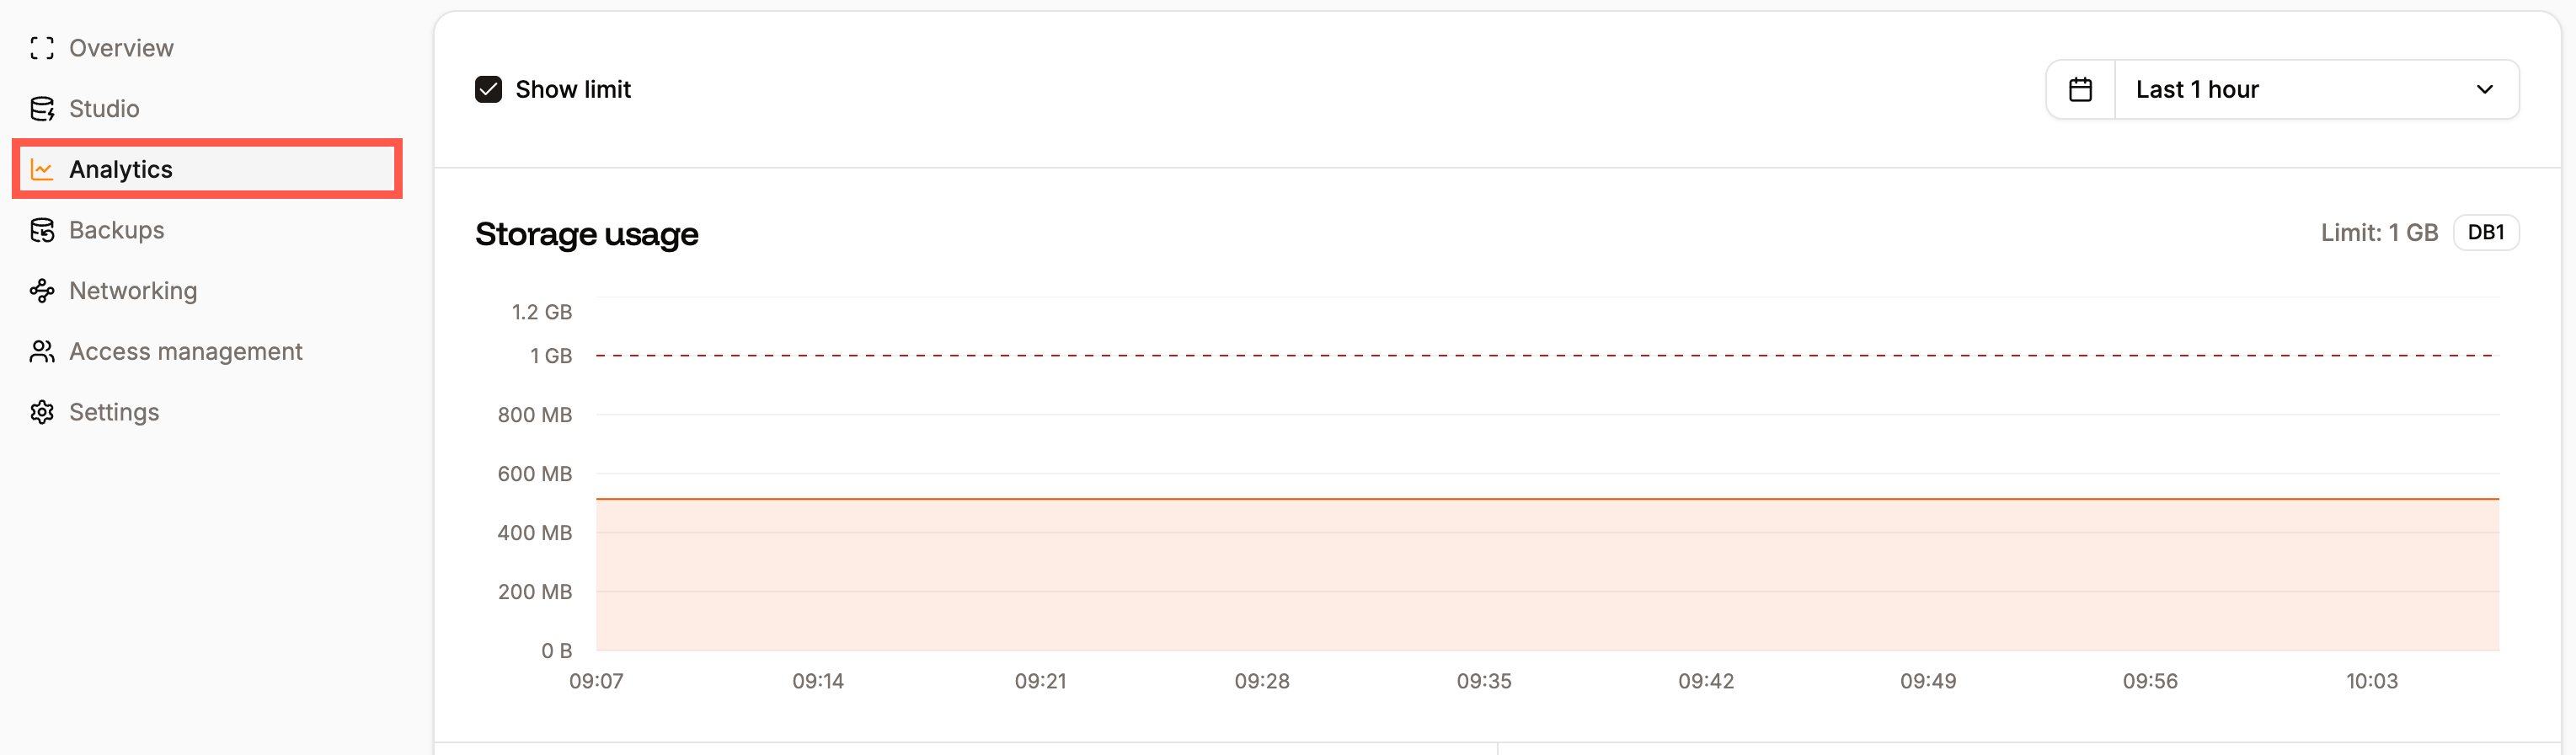
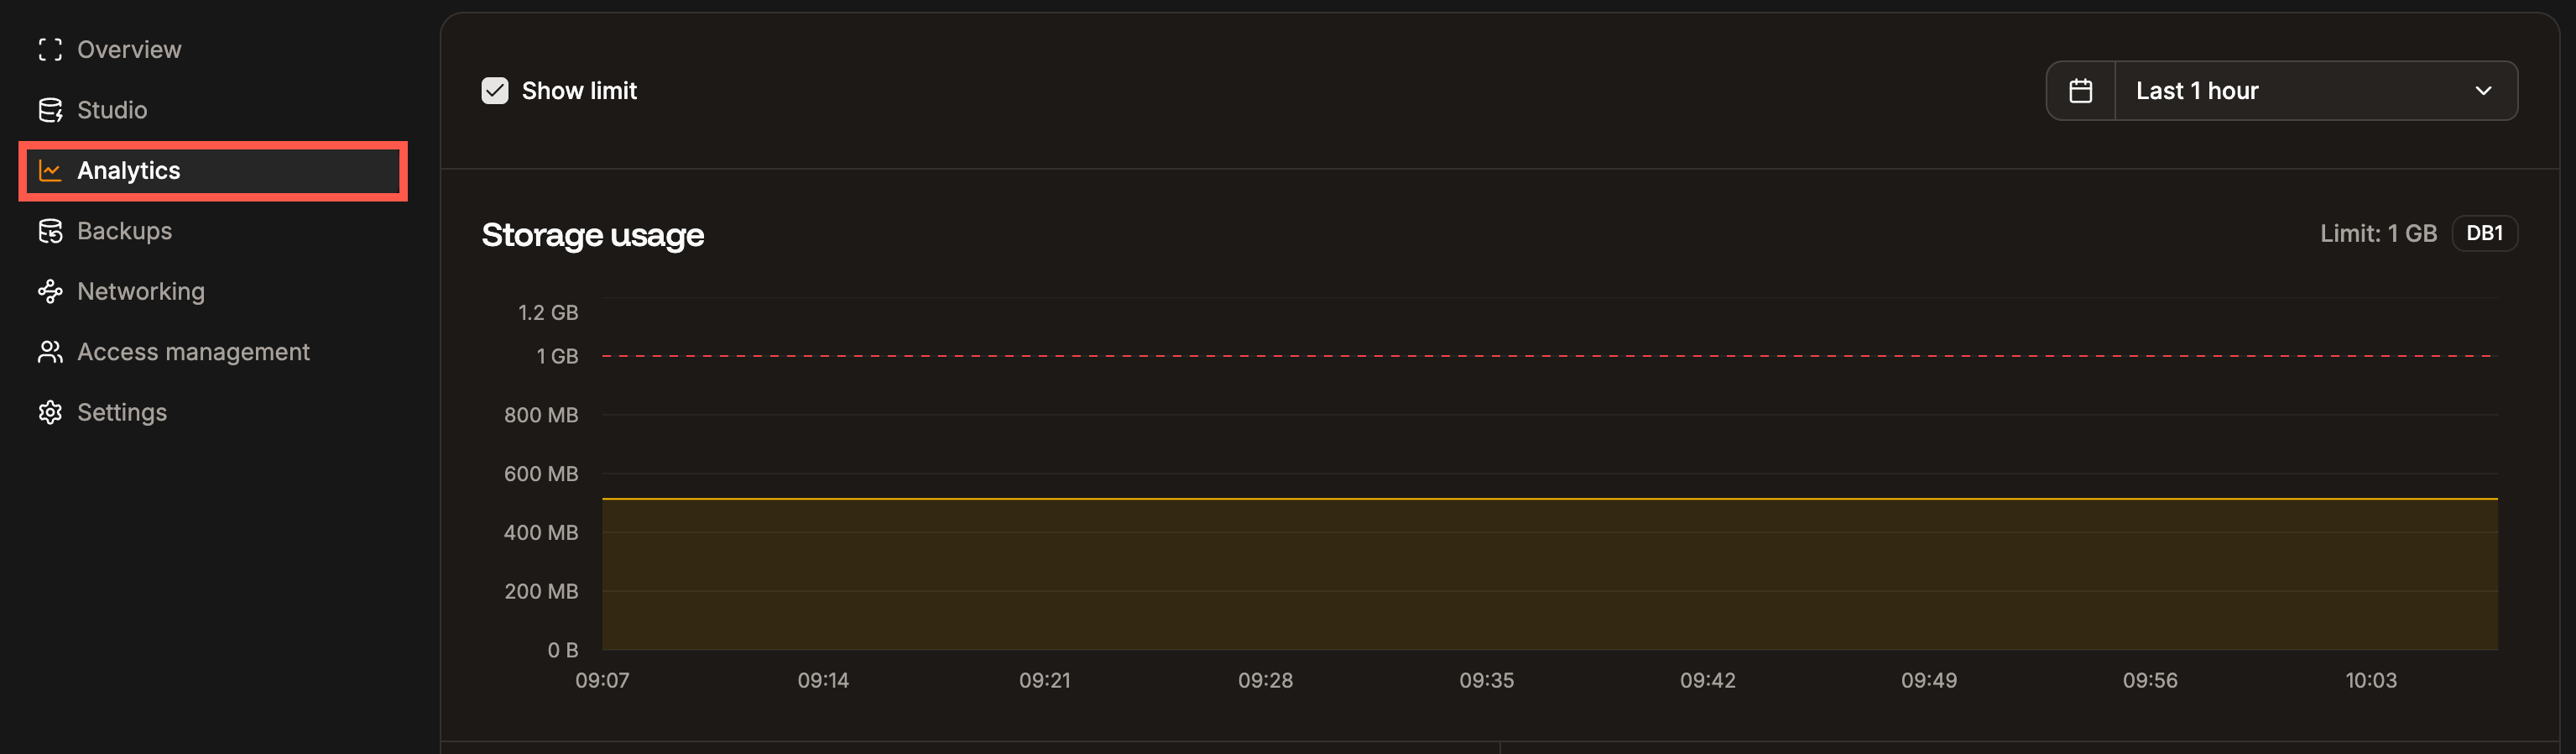
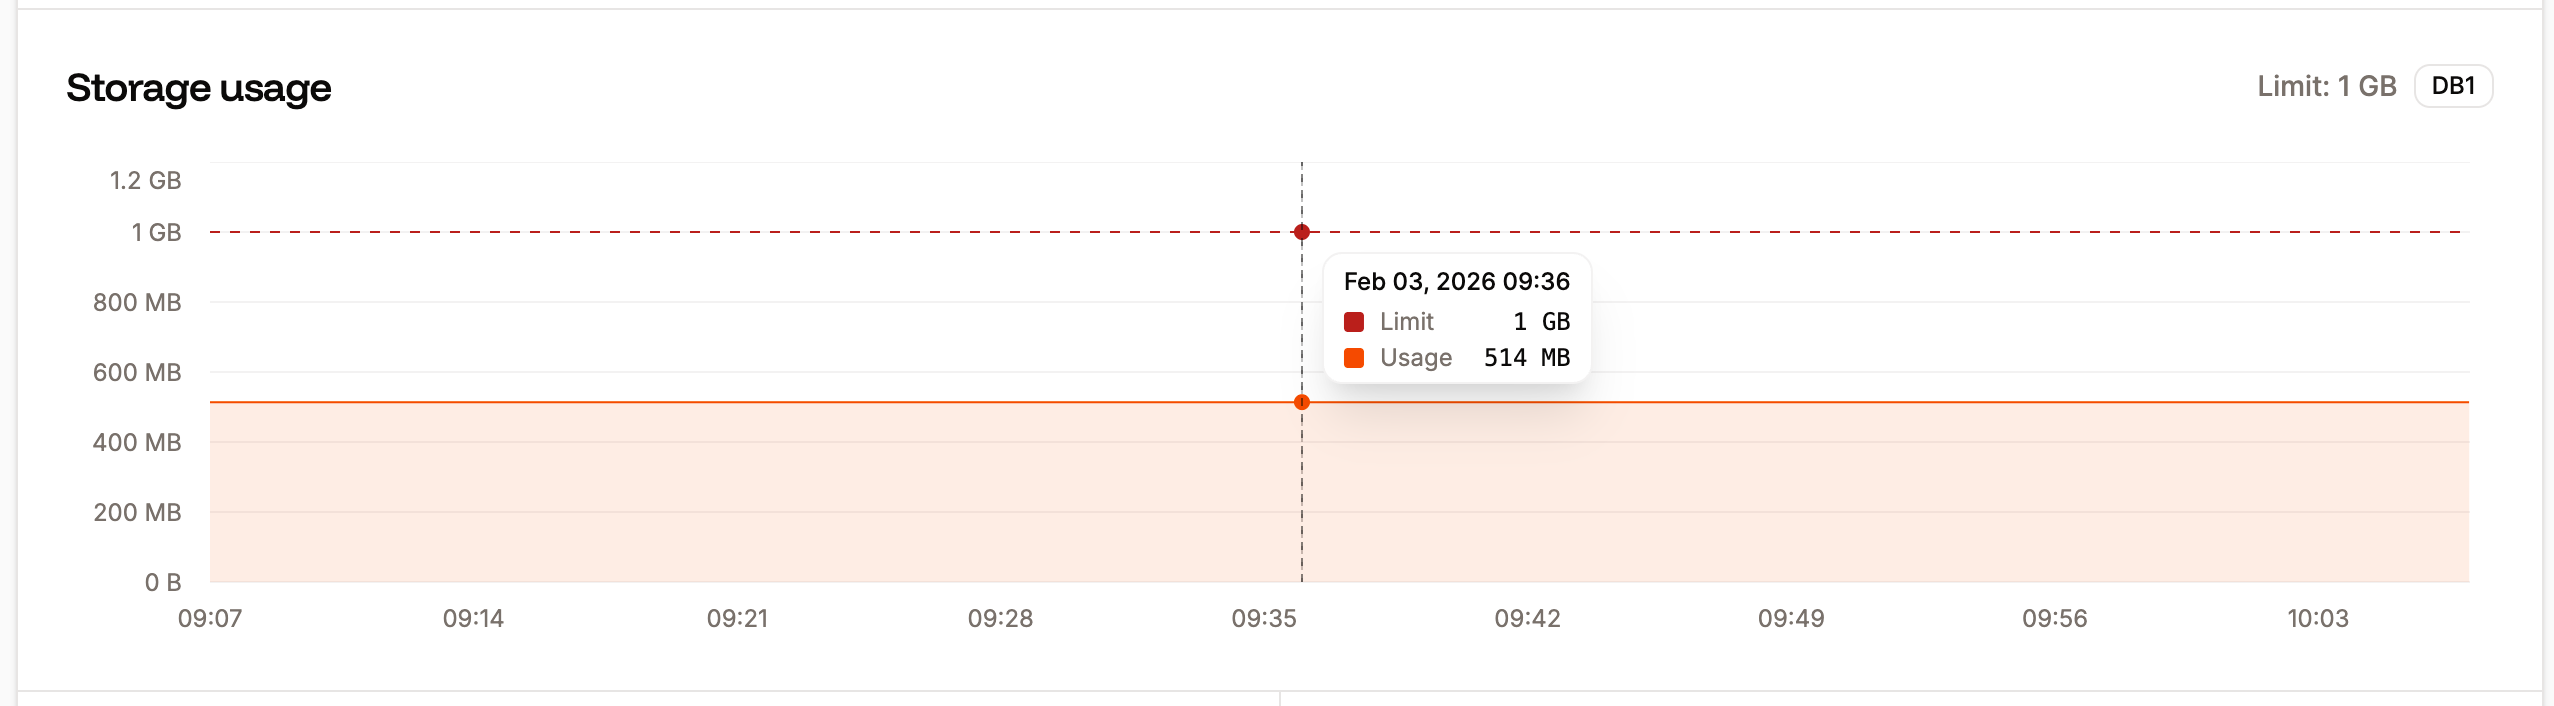
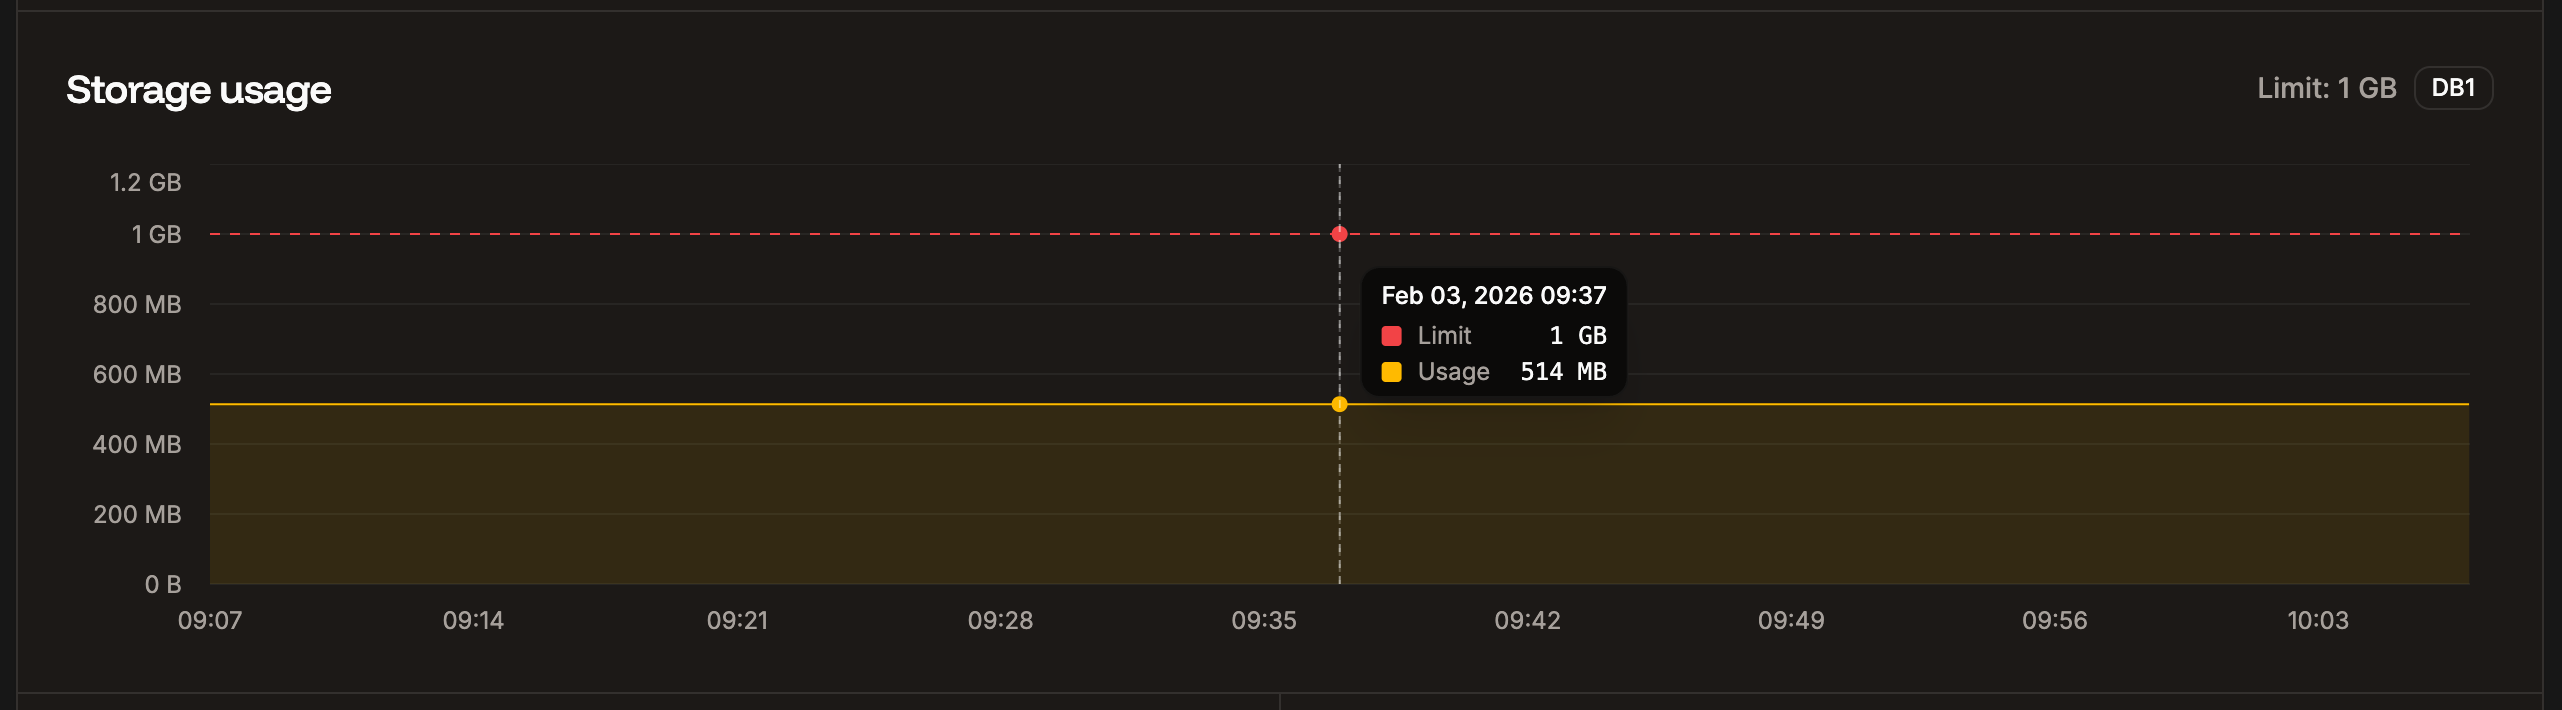
The Storage usage chart shows the data stored in the database (including any add-on storage) for the selected time period. Select **Show limit** to compare your usage to your service's resource limit.
Relational databases such as MariaDB and MySQL organize data in predefined relationships where data is stored in tables (or "relations") of columns and rows to make it easy to see and understand how different data structures relate to each other. This means the database size includes these relations and, therefore, will always be larger than the actual data in the database.
### Storage usage
The Storage usage chart shows the data stored in the database (including any add-on storage) for the selected time period. Select **Show limit** to compare your usage to your service's resource limit.
Relational databases such as MariaDB and MySQL organize data in predefined relationships where data is stored in tables (or "relations") of columns and rows to make it easy to see and understand how different data structures relate to each other. This means the database size includes these relations and, therefore, will always be larger than the actual data in the database.
 ### Memory usage
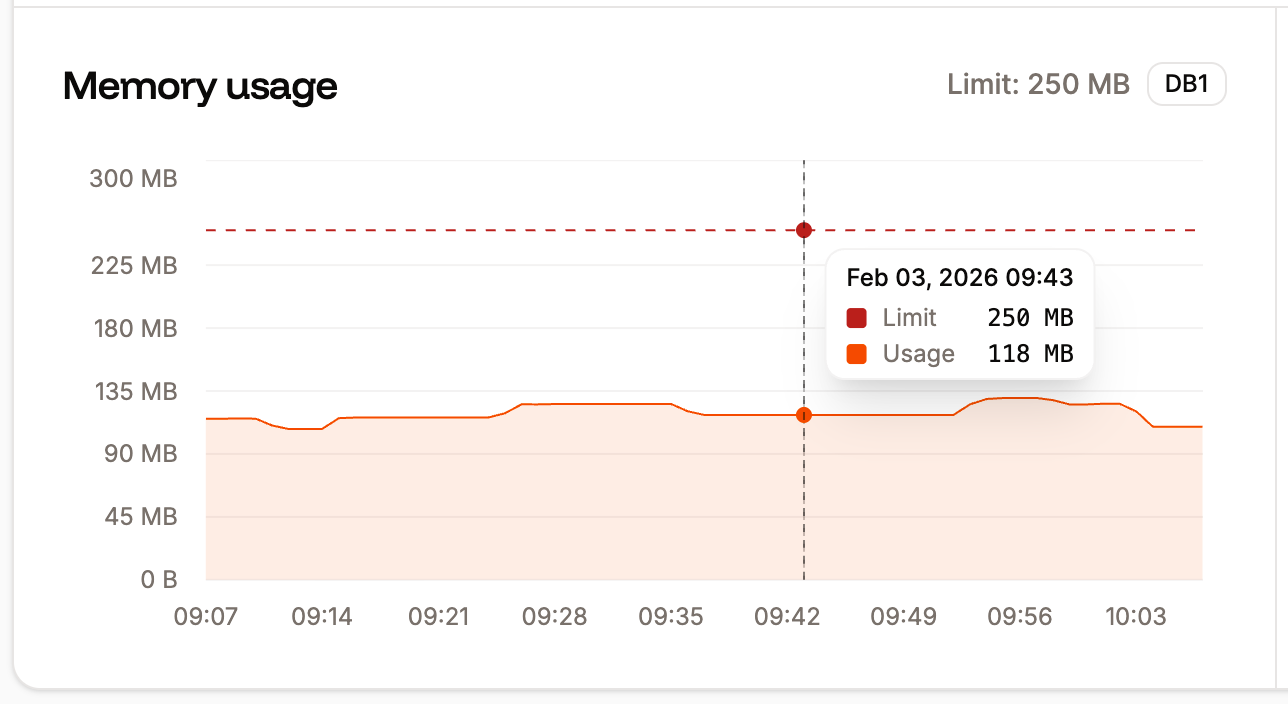
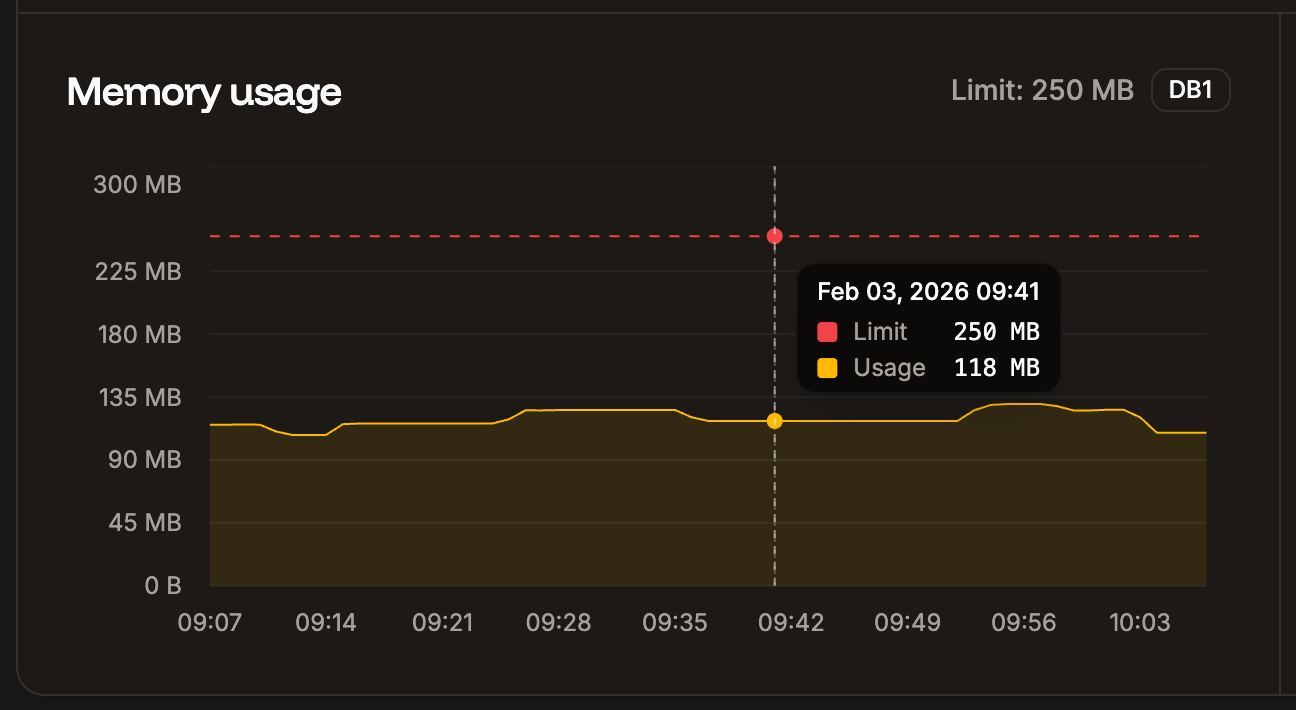
The Memory usage chart shows the average of the total memory (RAM) used for the selected time period. Select **Show limit** to compare your usage to your service's resource limit. If a database is using most or all of the memory available, we recommend a larger database type with more available memory. You can increase the size in your [**Database Settings**](/databases/settings) (**Database Settings** > **Update details**) if you need a larger database.
### Memory usage
The Memory usage chart shows the average of the total memory (RAM) used for the selected time period. Select **Show limit** to compare your usage to your service's resource limit. If a database is using most or all of the memory available, we recommend a larger database type with more available memory. You can increase the size in your [**Database Settings**](/databases/settings) (**Database Settings** > **Update details**) if you need a larger database.
 Due to the size of the databases in Database Hosting plans 7-9, to ensure the stability and speed of the database application, the amount of usable RAM and CPU may be 4.4% – 9.4% less than indicated. These resources remain dedicated to the underlying system that runs your database.
### CPU usage
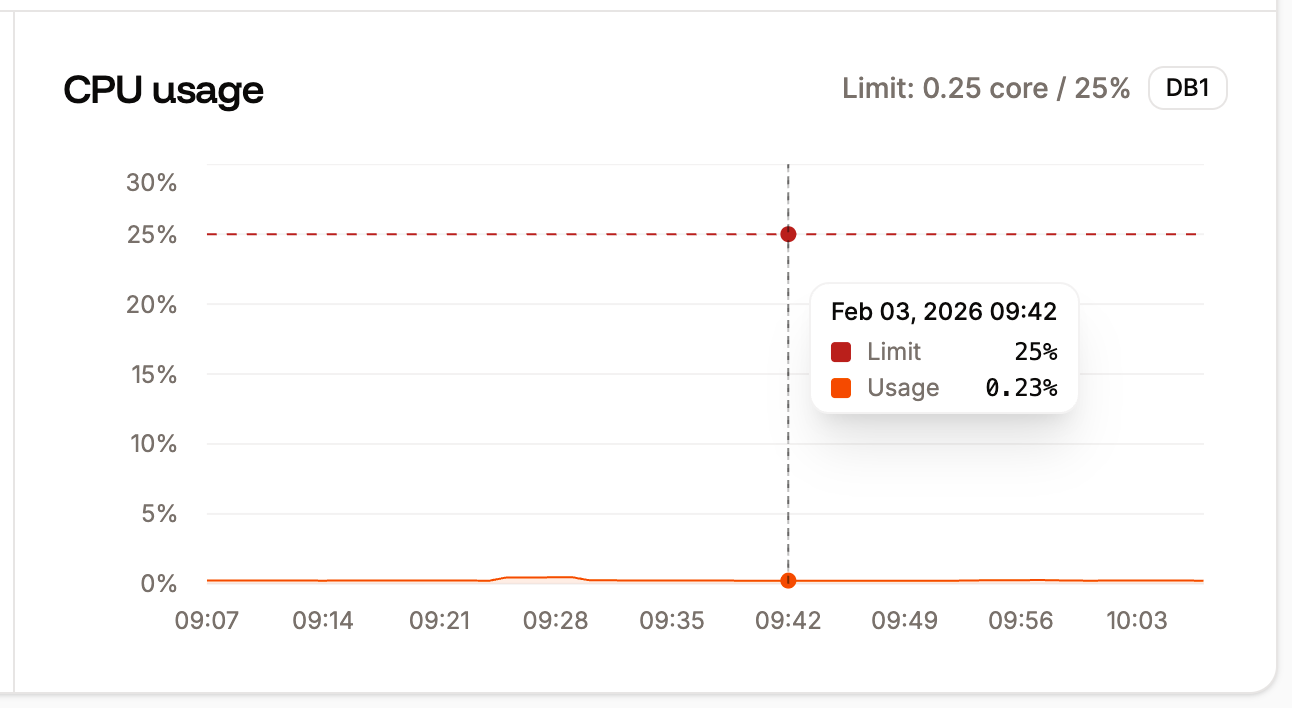
The CPU usage chart shows the average of the total CPU utilization for the selected time period, expressed as a percentage of the instance's CPU resources. Select **Show limit** to compare your usage to your service's resource limit. If you see a high percentage of CPU usage (near 100%), we recommend a larger database type with more available CPU. You can change the size in your [**Database Settings**](/databases/settings) (**Database Settings** > **Update details**) if you need a larger database.
Due to the size of the databases in Database Hosting plans 7-9, to ensure the stability and speed of the database application, the amount of usable RAM and CPU may be 4.4% – 9.4% less than indicated. These resources remain dedicated to the underlying system that runs your database.
### CPU usage
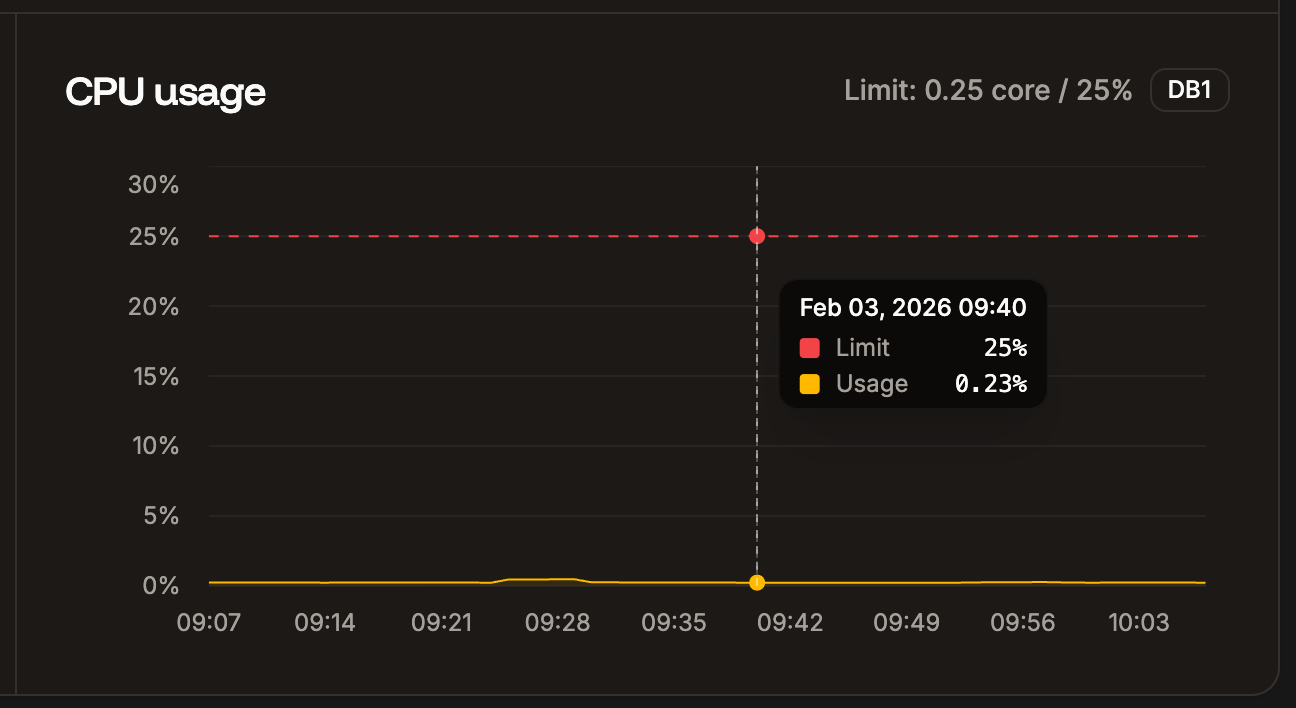
The CPU usage chart shows the average of the total CPU utilization for the selected time period, expressed as a percentage of the instance's CPU resources. Select **Show limit** to compare your usage to your service's resource limit. If you see a high percentage of CPU usage (near 100%), we recommend a larger database type with more available CPU. You can change the size in your [**Database Settings**](/databases/settings) (**Database Settings** > **Update details**) if you need a larger database.
 ## Additional notes
Analytics data is retained for 30 days. We suggest checking your **Database Analytics** frequently after first creating your Database at Sevalla and periodically thereafter. If you see any unexplained analytics data or inconsistencies that concern you, let our Support team know, and we can further investigate to help determine the cause.
## Additional notes
Analytics data is retained for 30 days. We suggest checking your **Database Analytics** frequently after first creating your Database at Sevalla and periodically thereafter. If you see any unexplained analytics data or inconsistencies that concern you, let our Support team know, and we can further investigate to help determine the cause.