> ## Documentation Index
> Fetch the complete documentation index at: https://docs.sevalla.com/llms.txt
> Use this file to discover all available pages before exploring further.
# Load balancers - Analytics
> View detailed analytics for your load balancers.
Load balancer analytics give you clear visibility into how your traffic is performing and where it’s coming from. These insights help you monitor performance, troubleshoot issues faster, and make informed scaling decisions.
When viewing the analytics, you can choose to see data for the past 1 hour, 6 hours, 12 hours, 1 day, 2 days, 4 days, 7 days, 14 days, or 30 days, or select a specific date and time period.
When you hover over a chart, a reference line appears; you can click and drag this reference line to zoom into a specific time period.
You can filter the charts using **Add filter**. This filters all of the charts on the page. The following options are available:
* Destination
* Source IP
* Country
* Device type
* HTTP method
* Path
* User agent
* HTTP version
* Status code
To view the analytics, click **Load balancers** > ***name*** > **Overview** and scroll down to the **Analytics** for that specific load balancer.
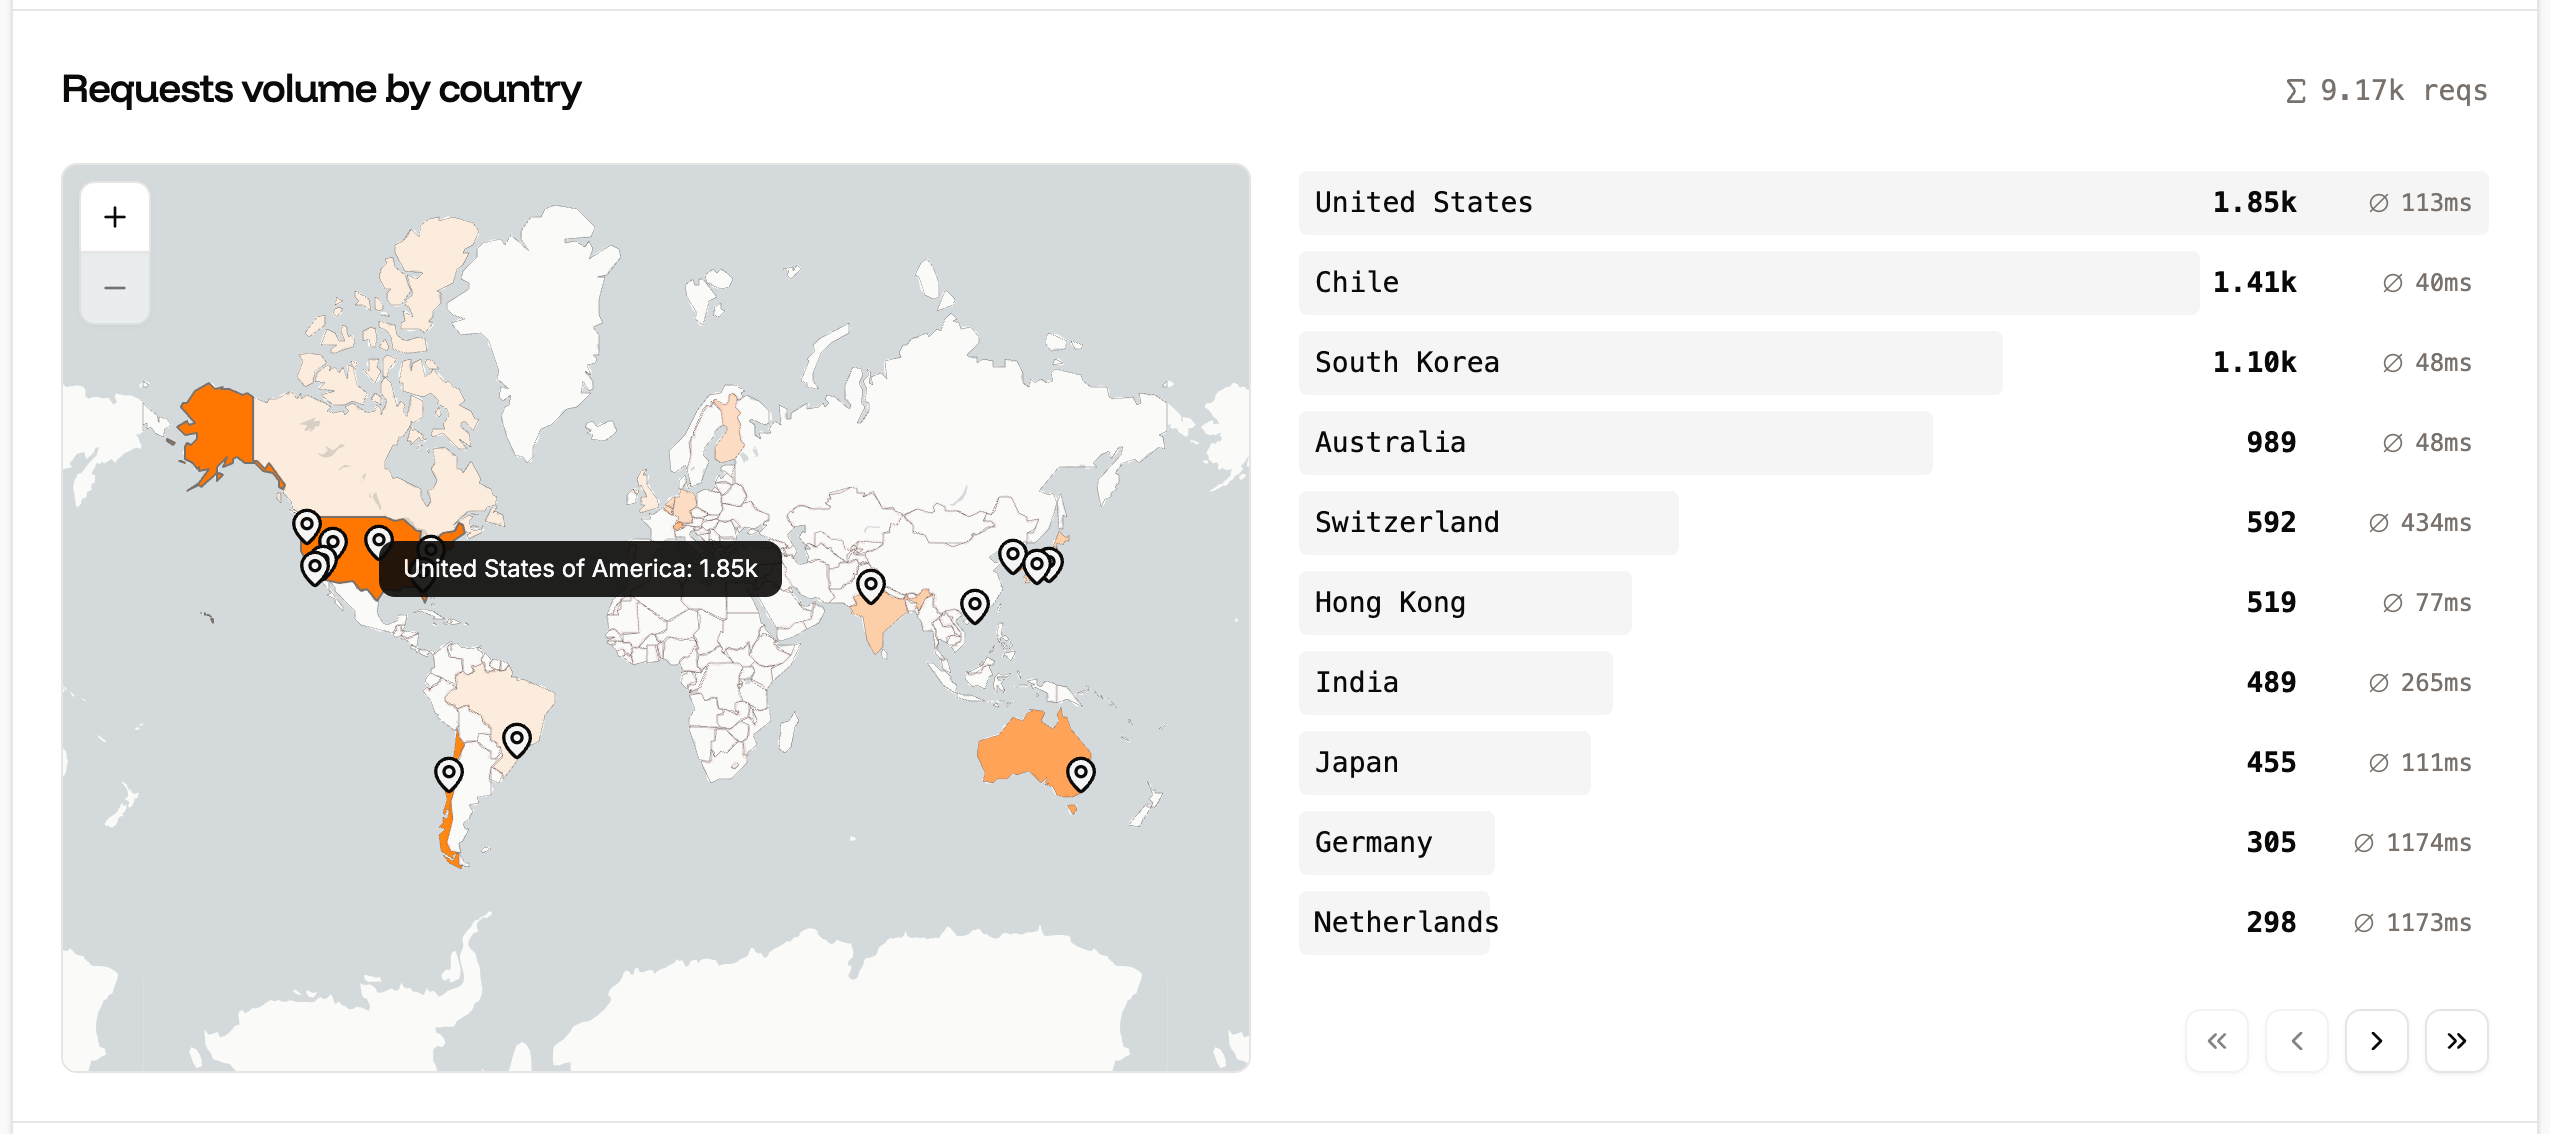
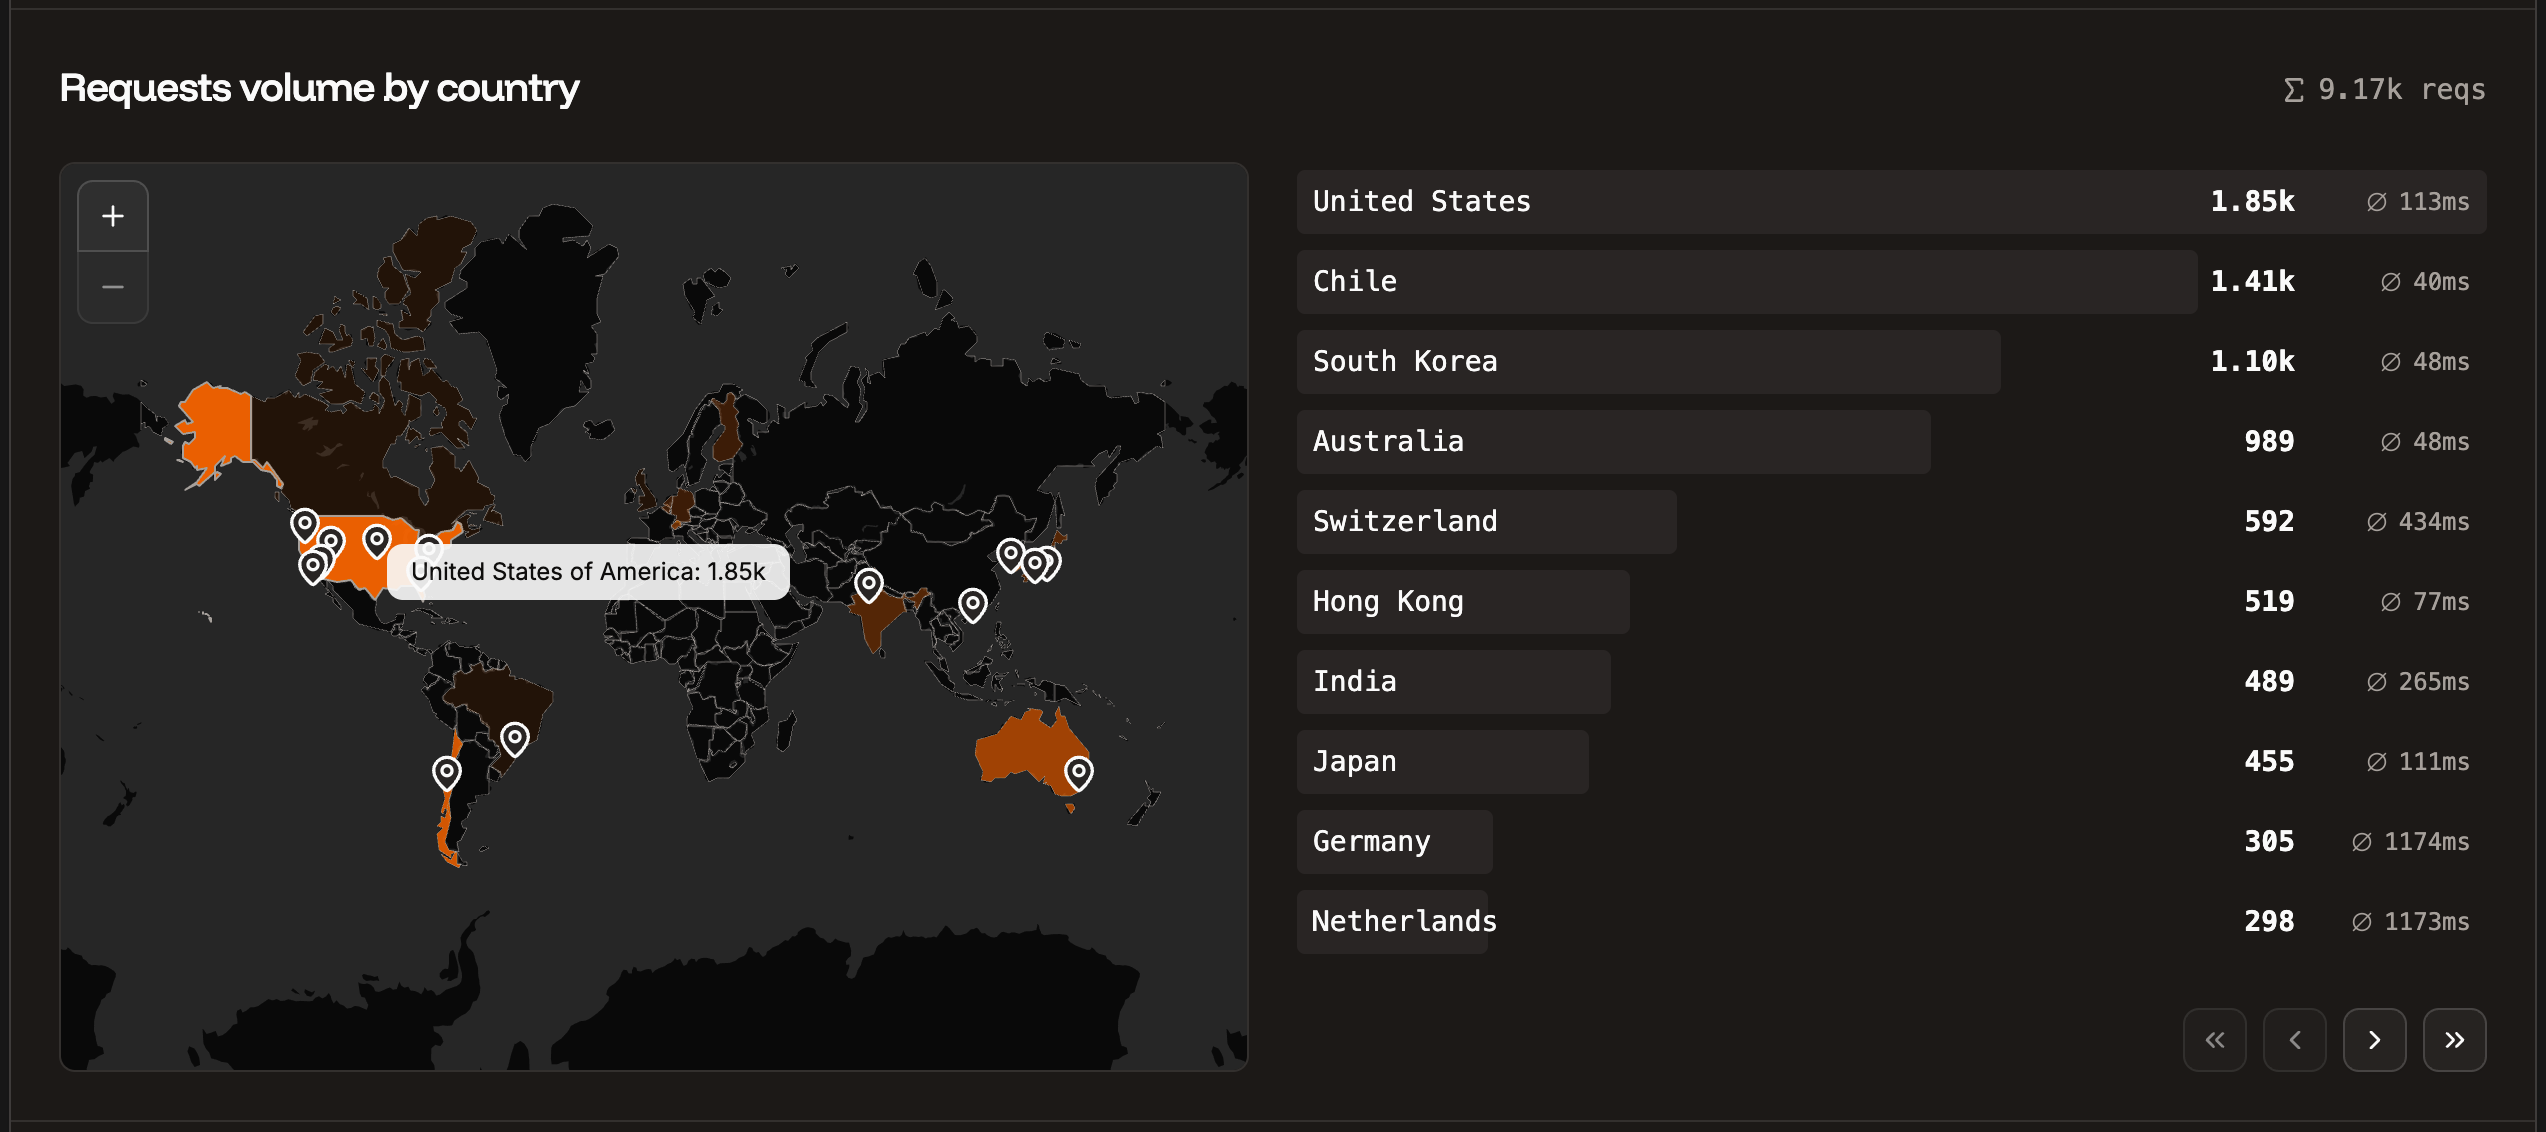
#### Requests volume by country
The Requests volume by country chart shows the number of requests, ranked by the country from which they originated. You can zoom in and out of the map, and hover over a country to see the exact number of requests from that location. You can also filter the chart to include or exclude specific countries.
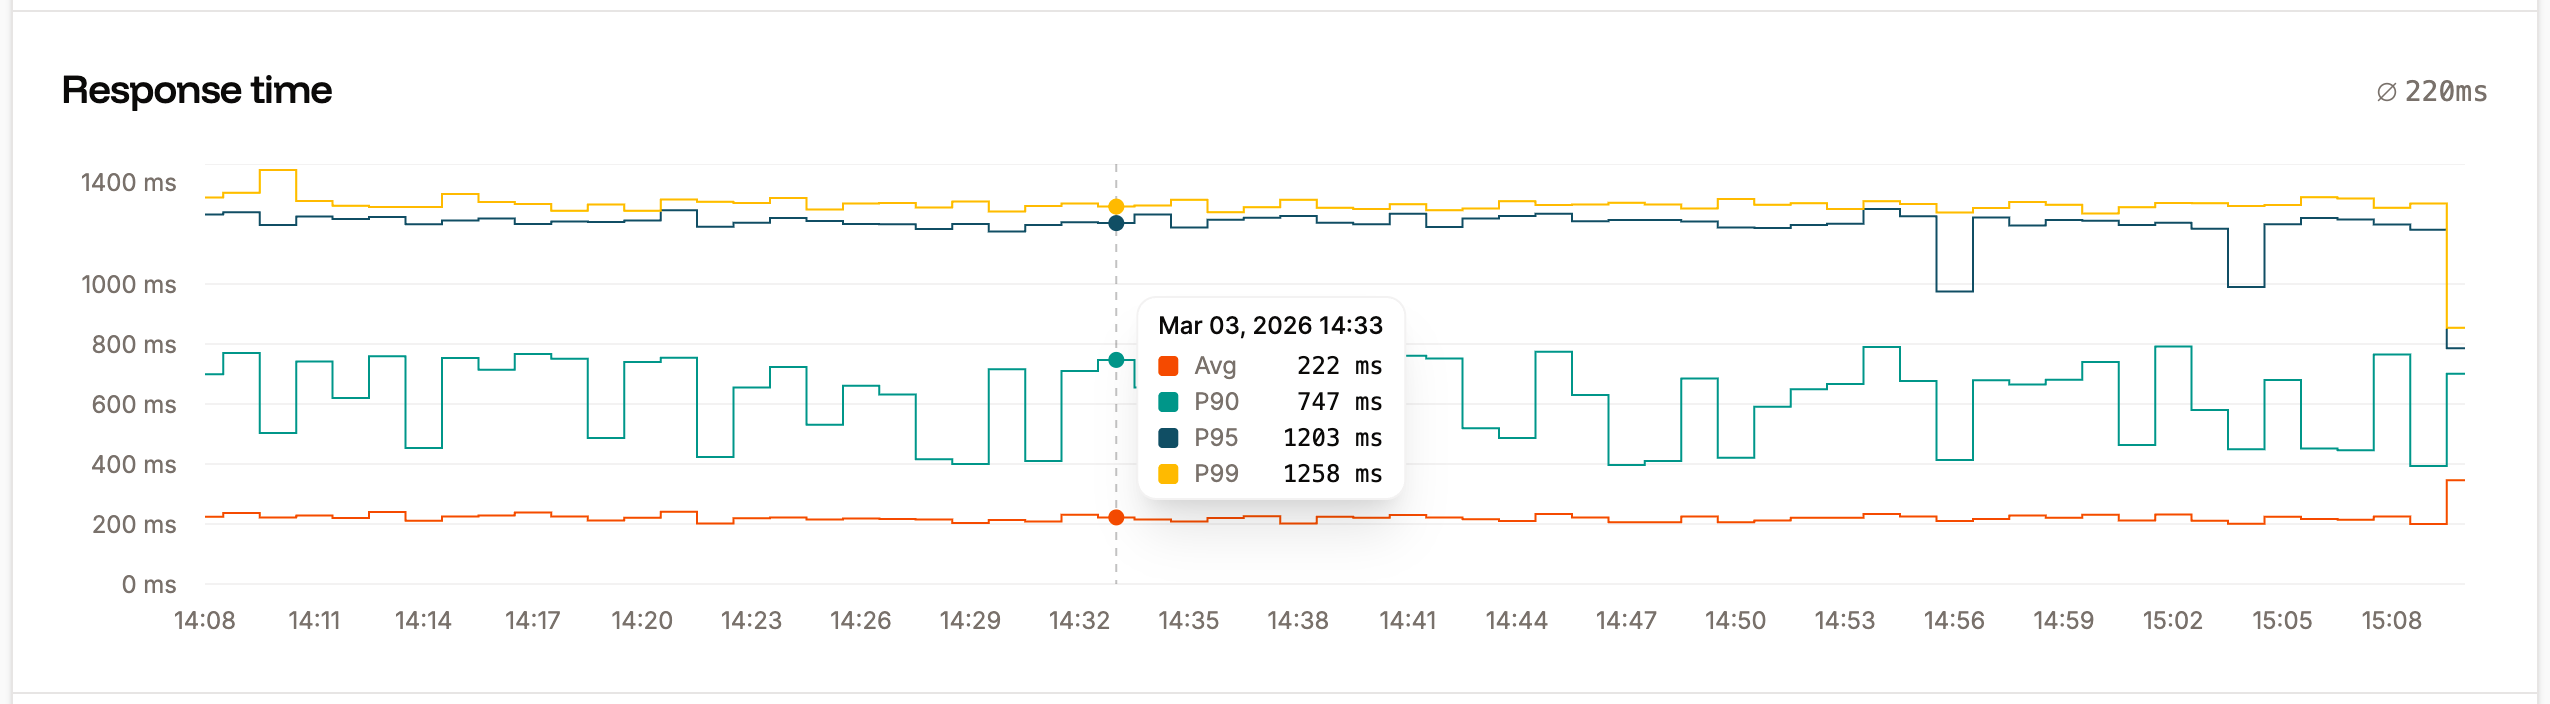
 #### Response time
The Response time chart shows the average response time for all HTTP requests for the time period selected.
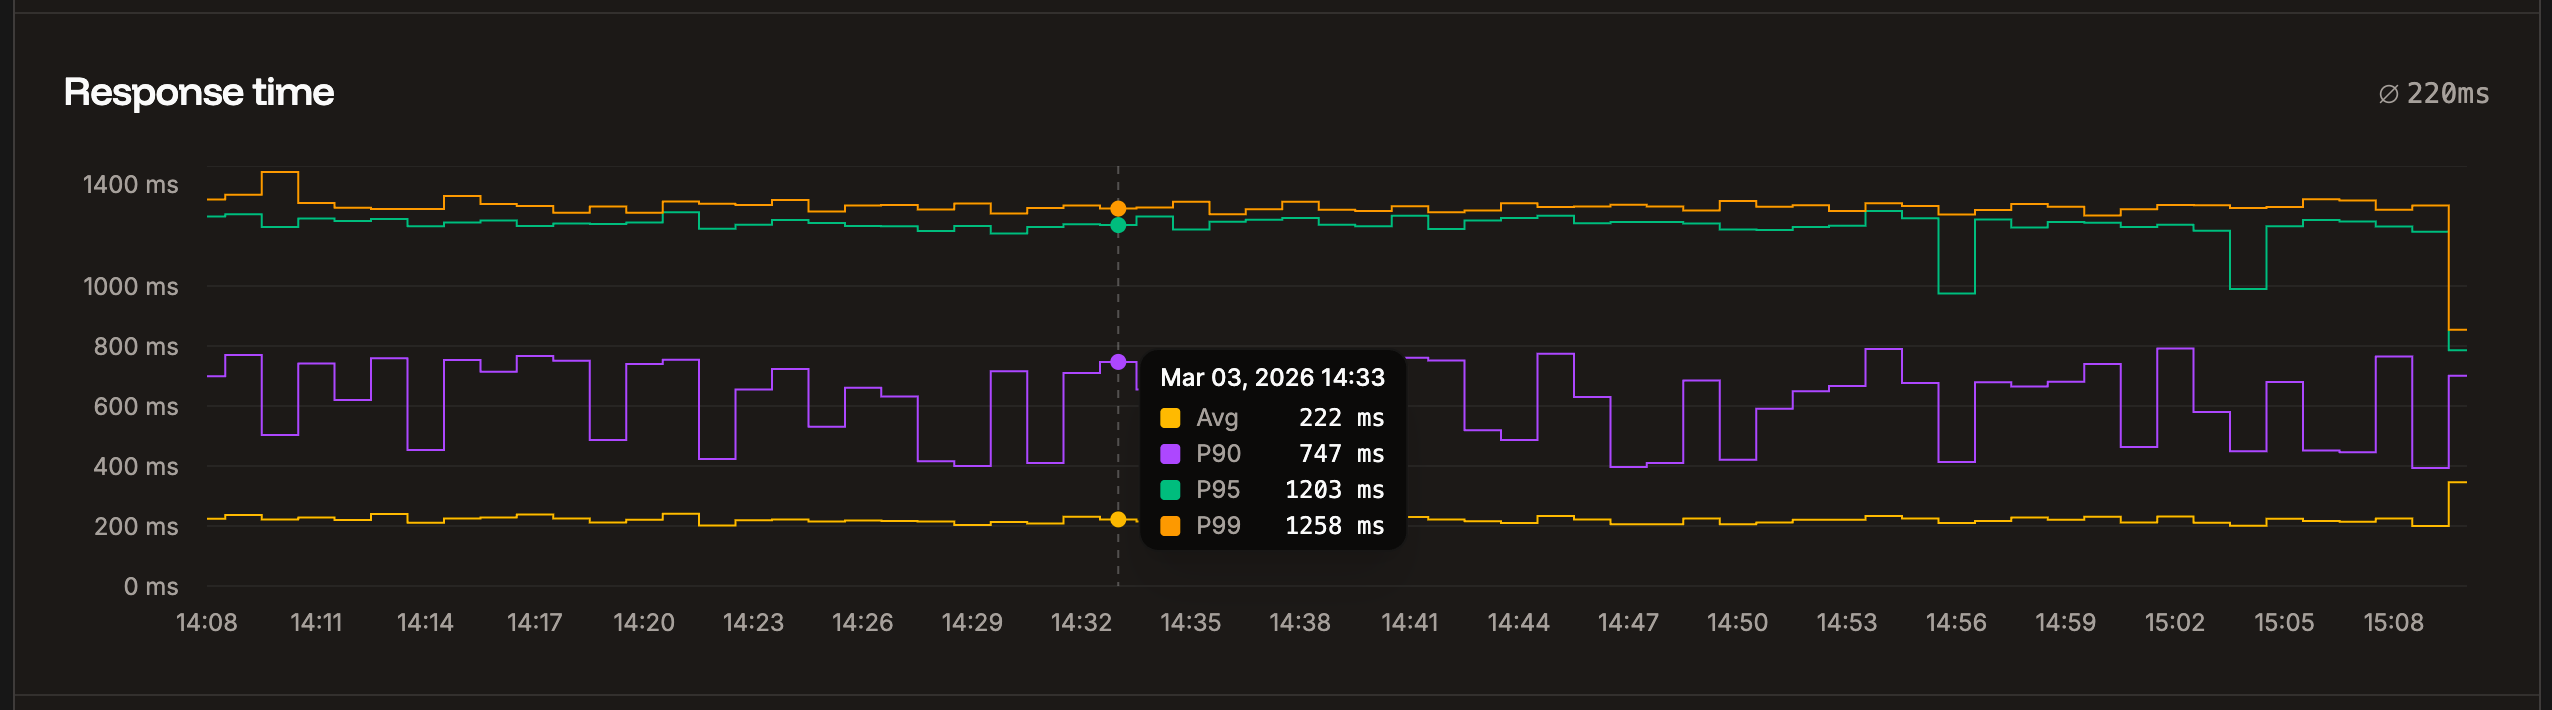
#### Response time
The Response time chart shows the average response time for all HTTP requests for the time period selected.
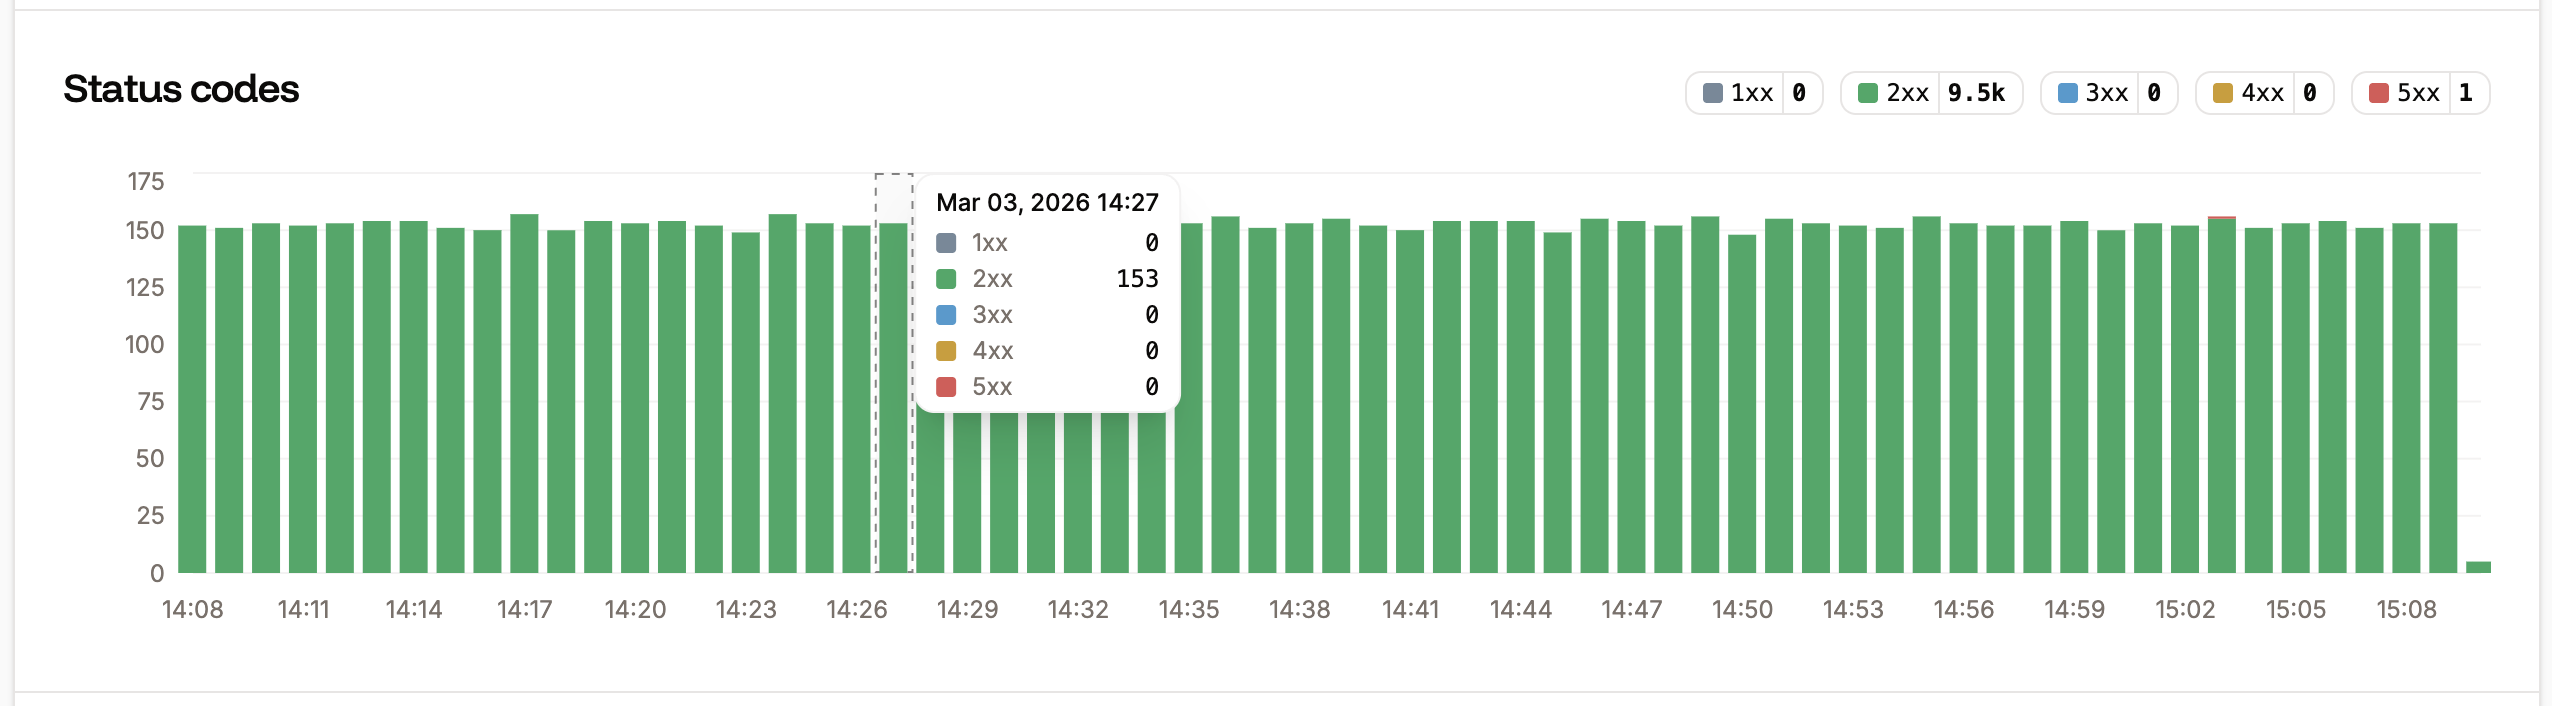
 #### Status codes
The Status codes chart displays the total number of each status code returned for requests. This is useful for analyzing your site to identify when requests return codes other than 200.
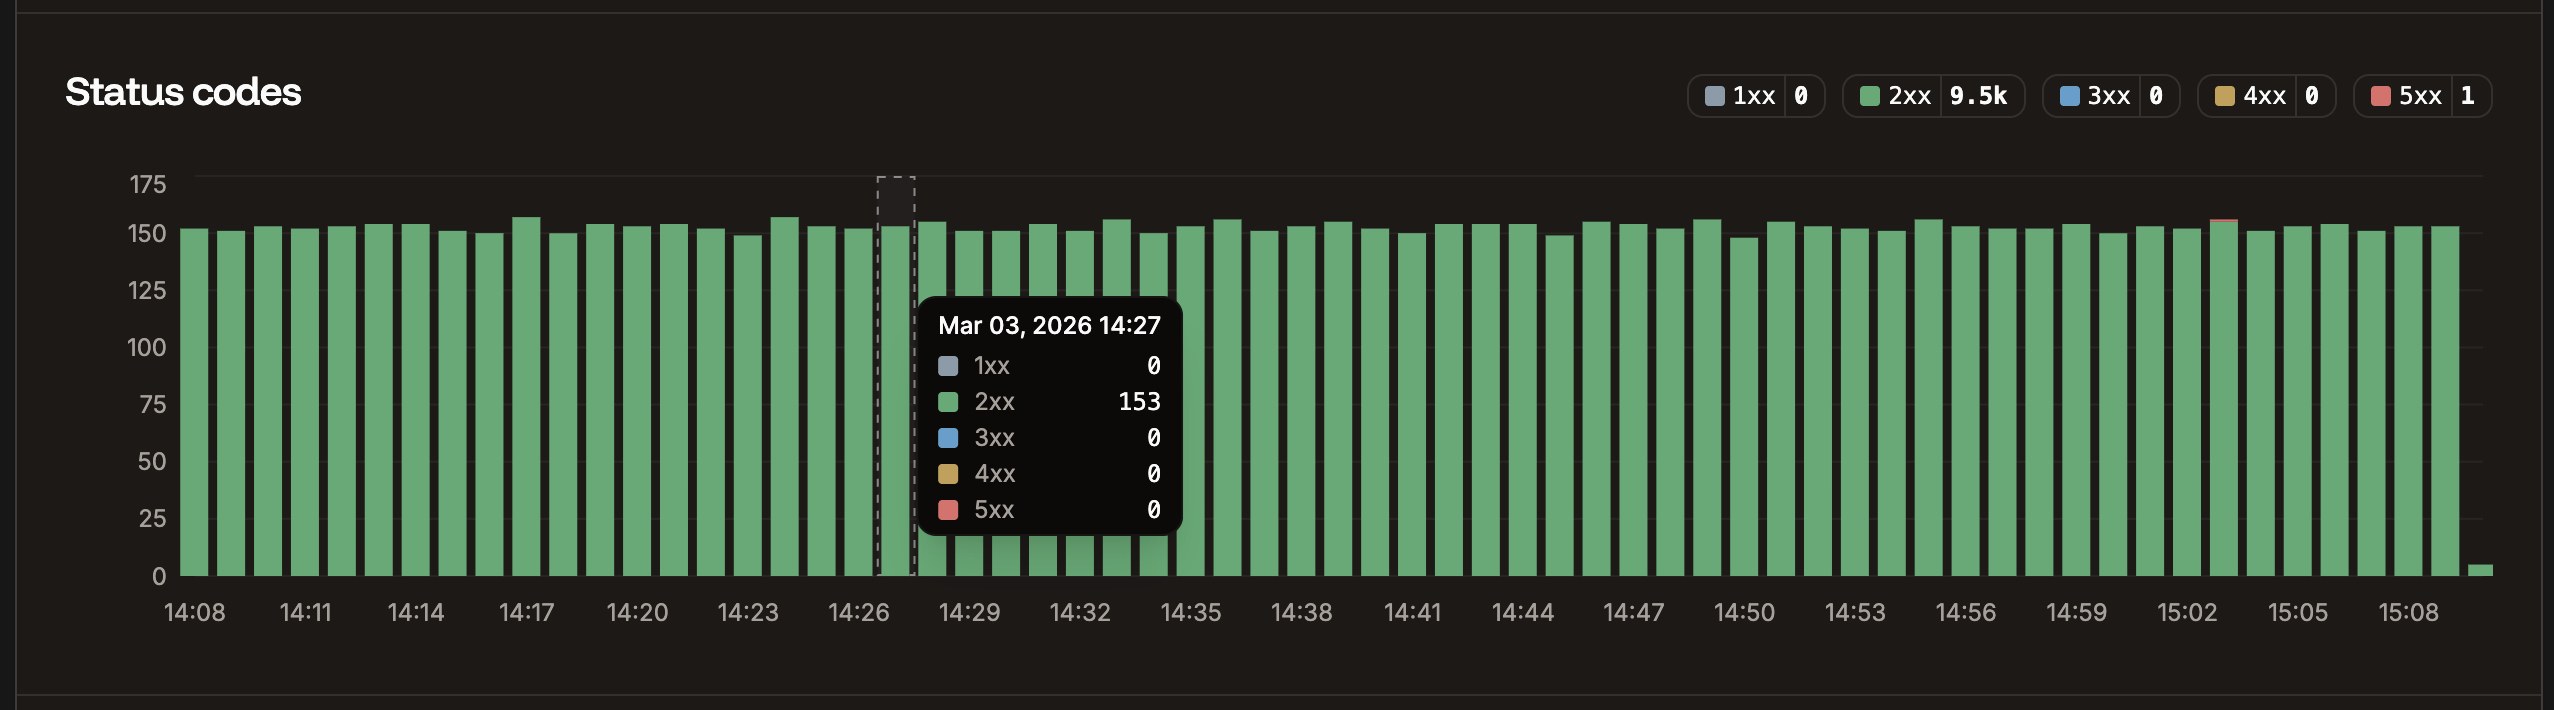
#### Status codes
The Status codes chart displays the total number of each status code returned for requests. This is useful for analyzing your site to identify when requests return codes other than 200.
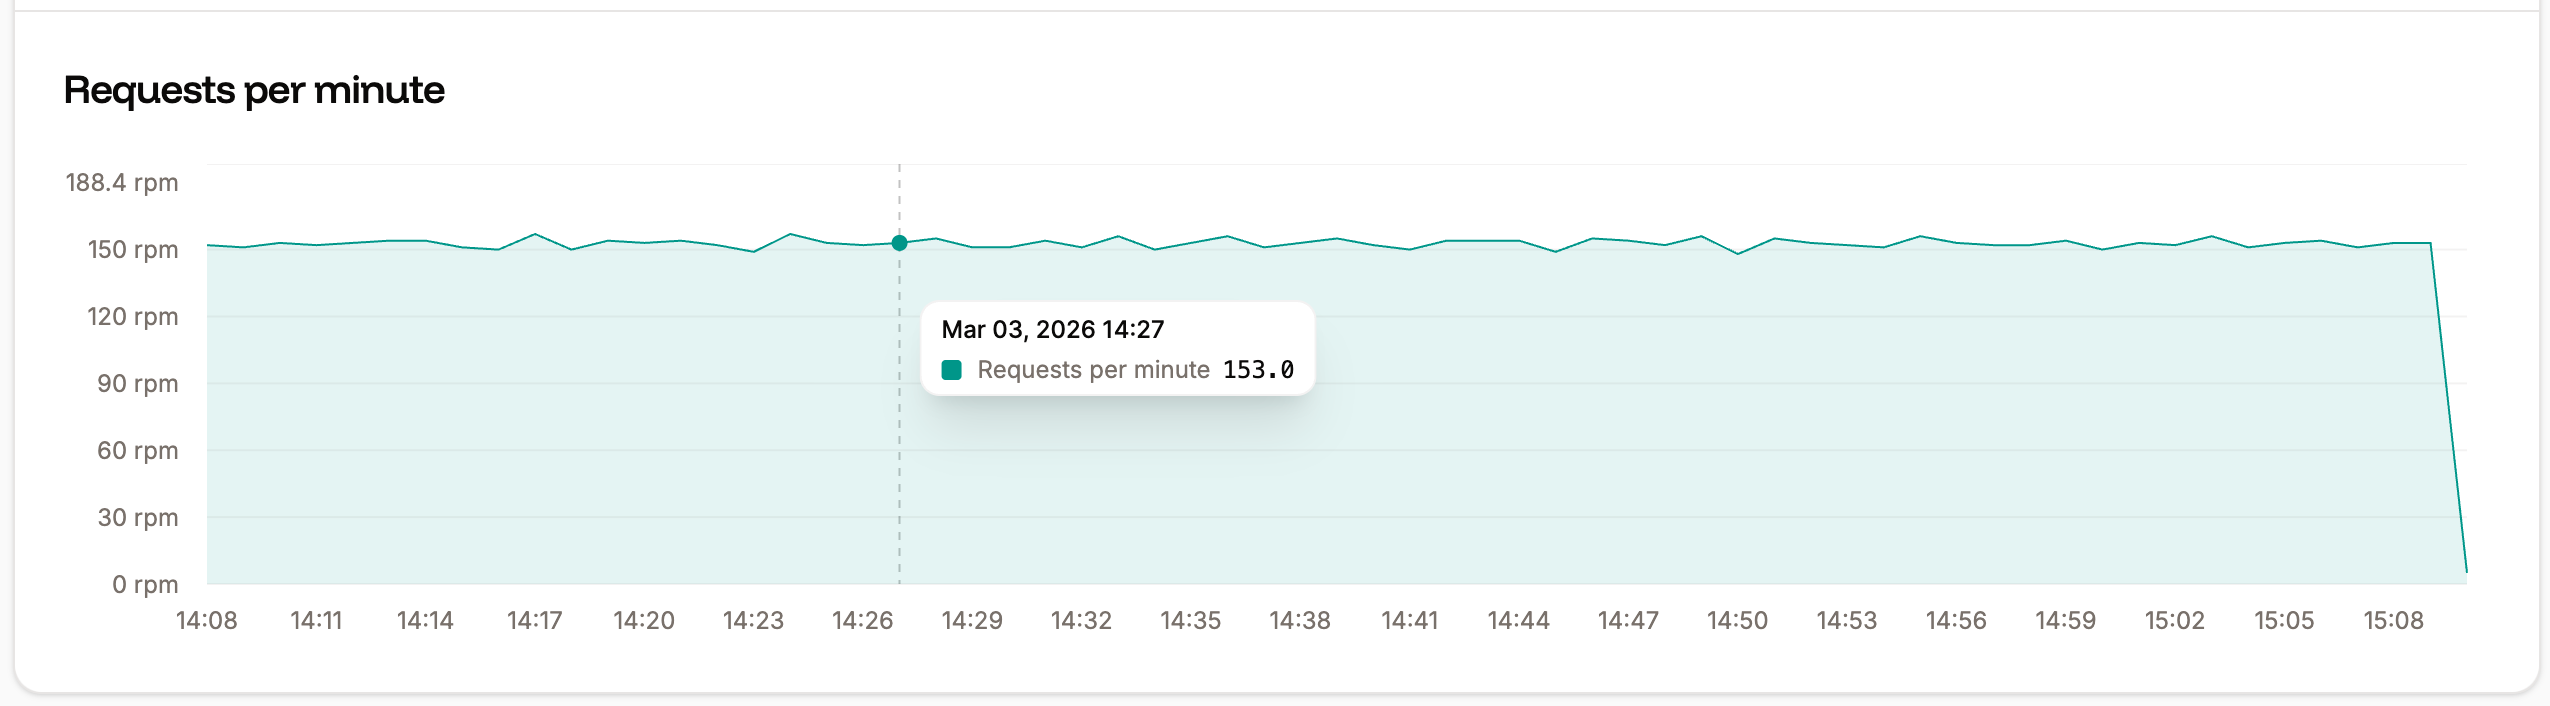
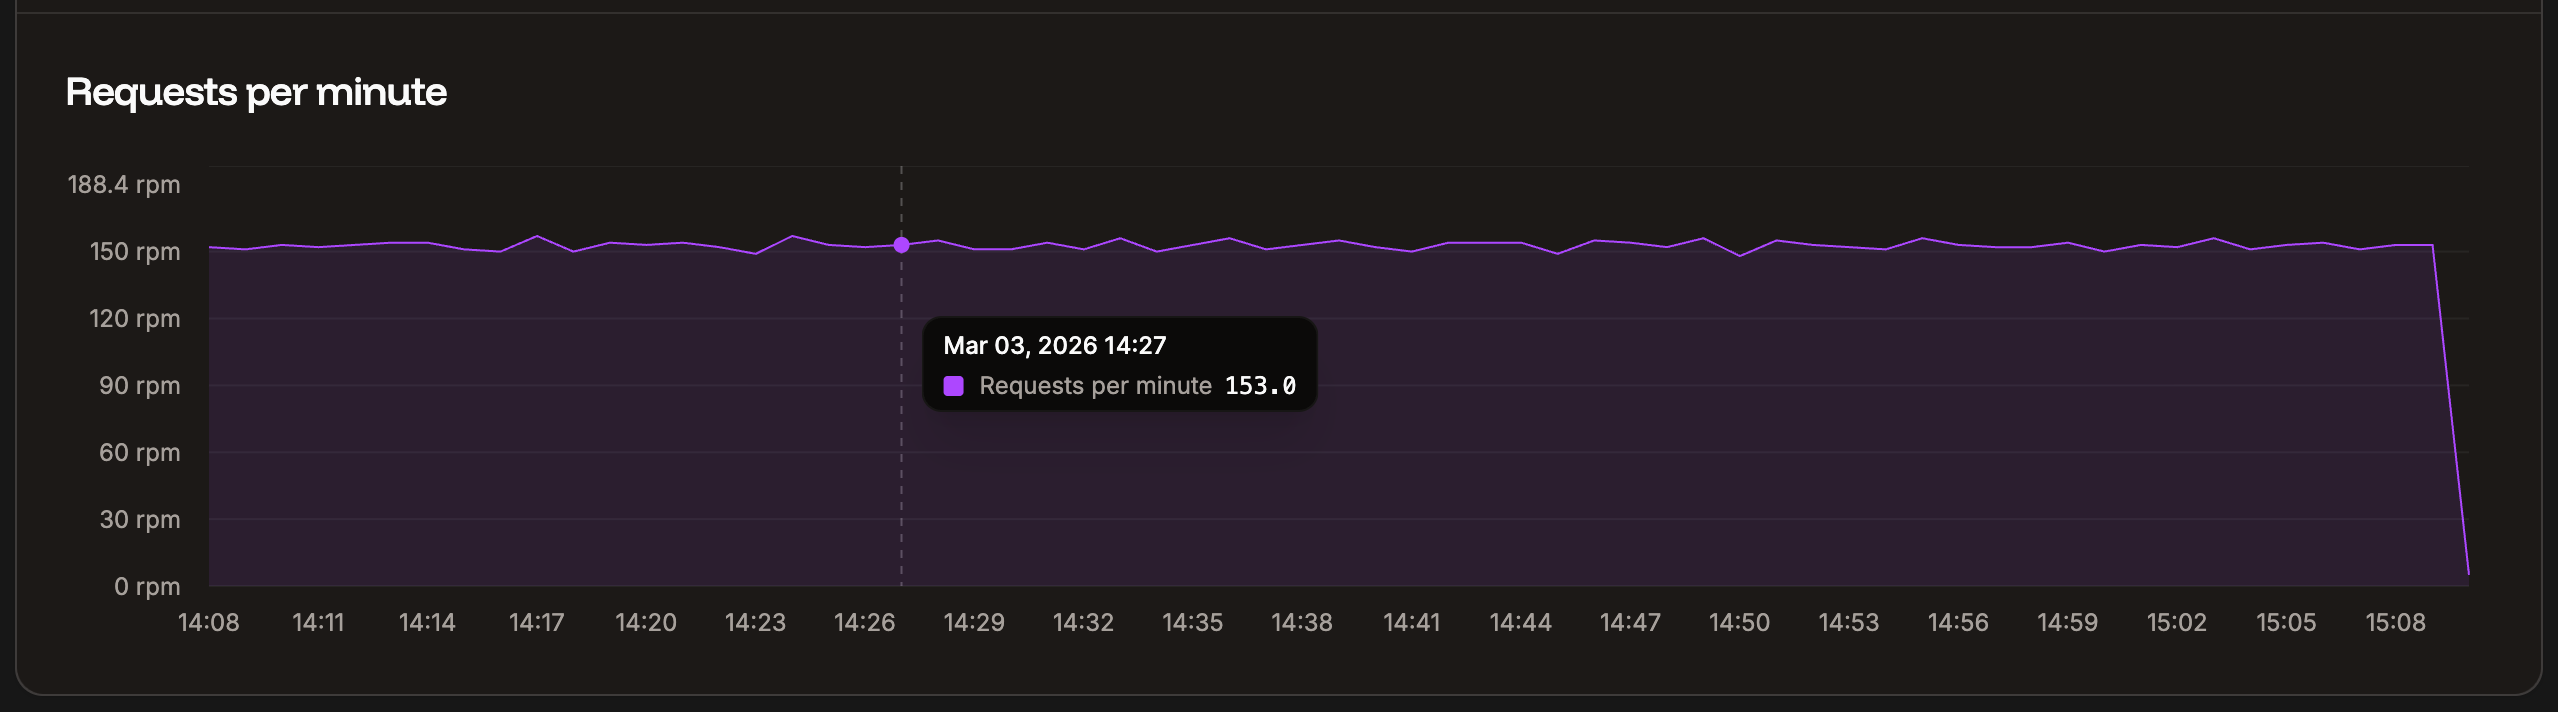
 #### Requests per minute
The Requests per minute chart shows the average requests per minute (RPM) of all HTTP requests for the time period selected.
#### Requests per minute
The Requests per minute chart shows the average requests per minute (RPM) of all HTTP requests for the time period selected.