

View analytics
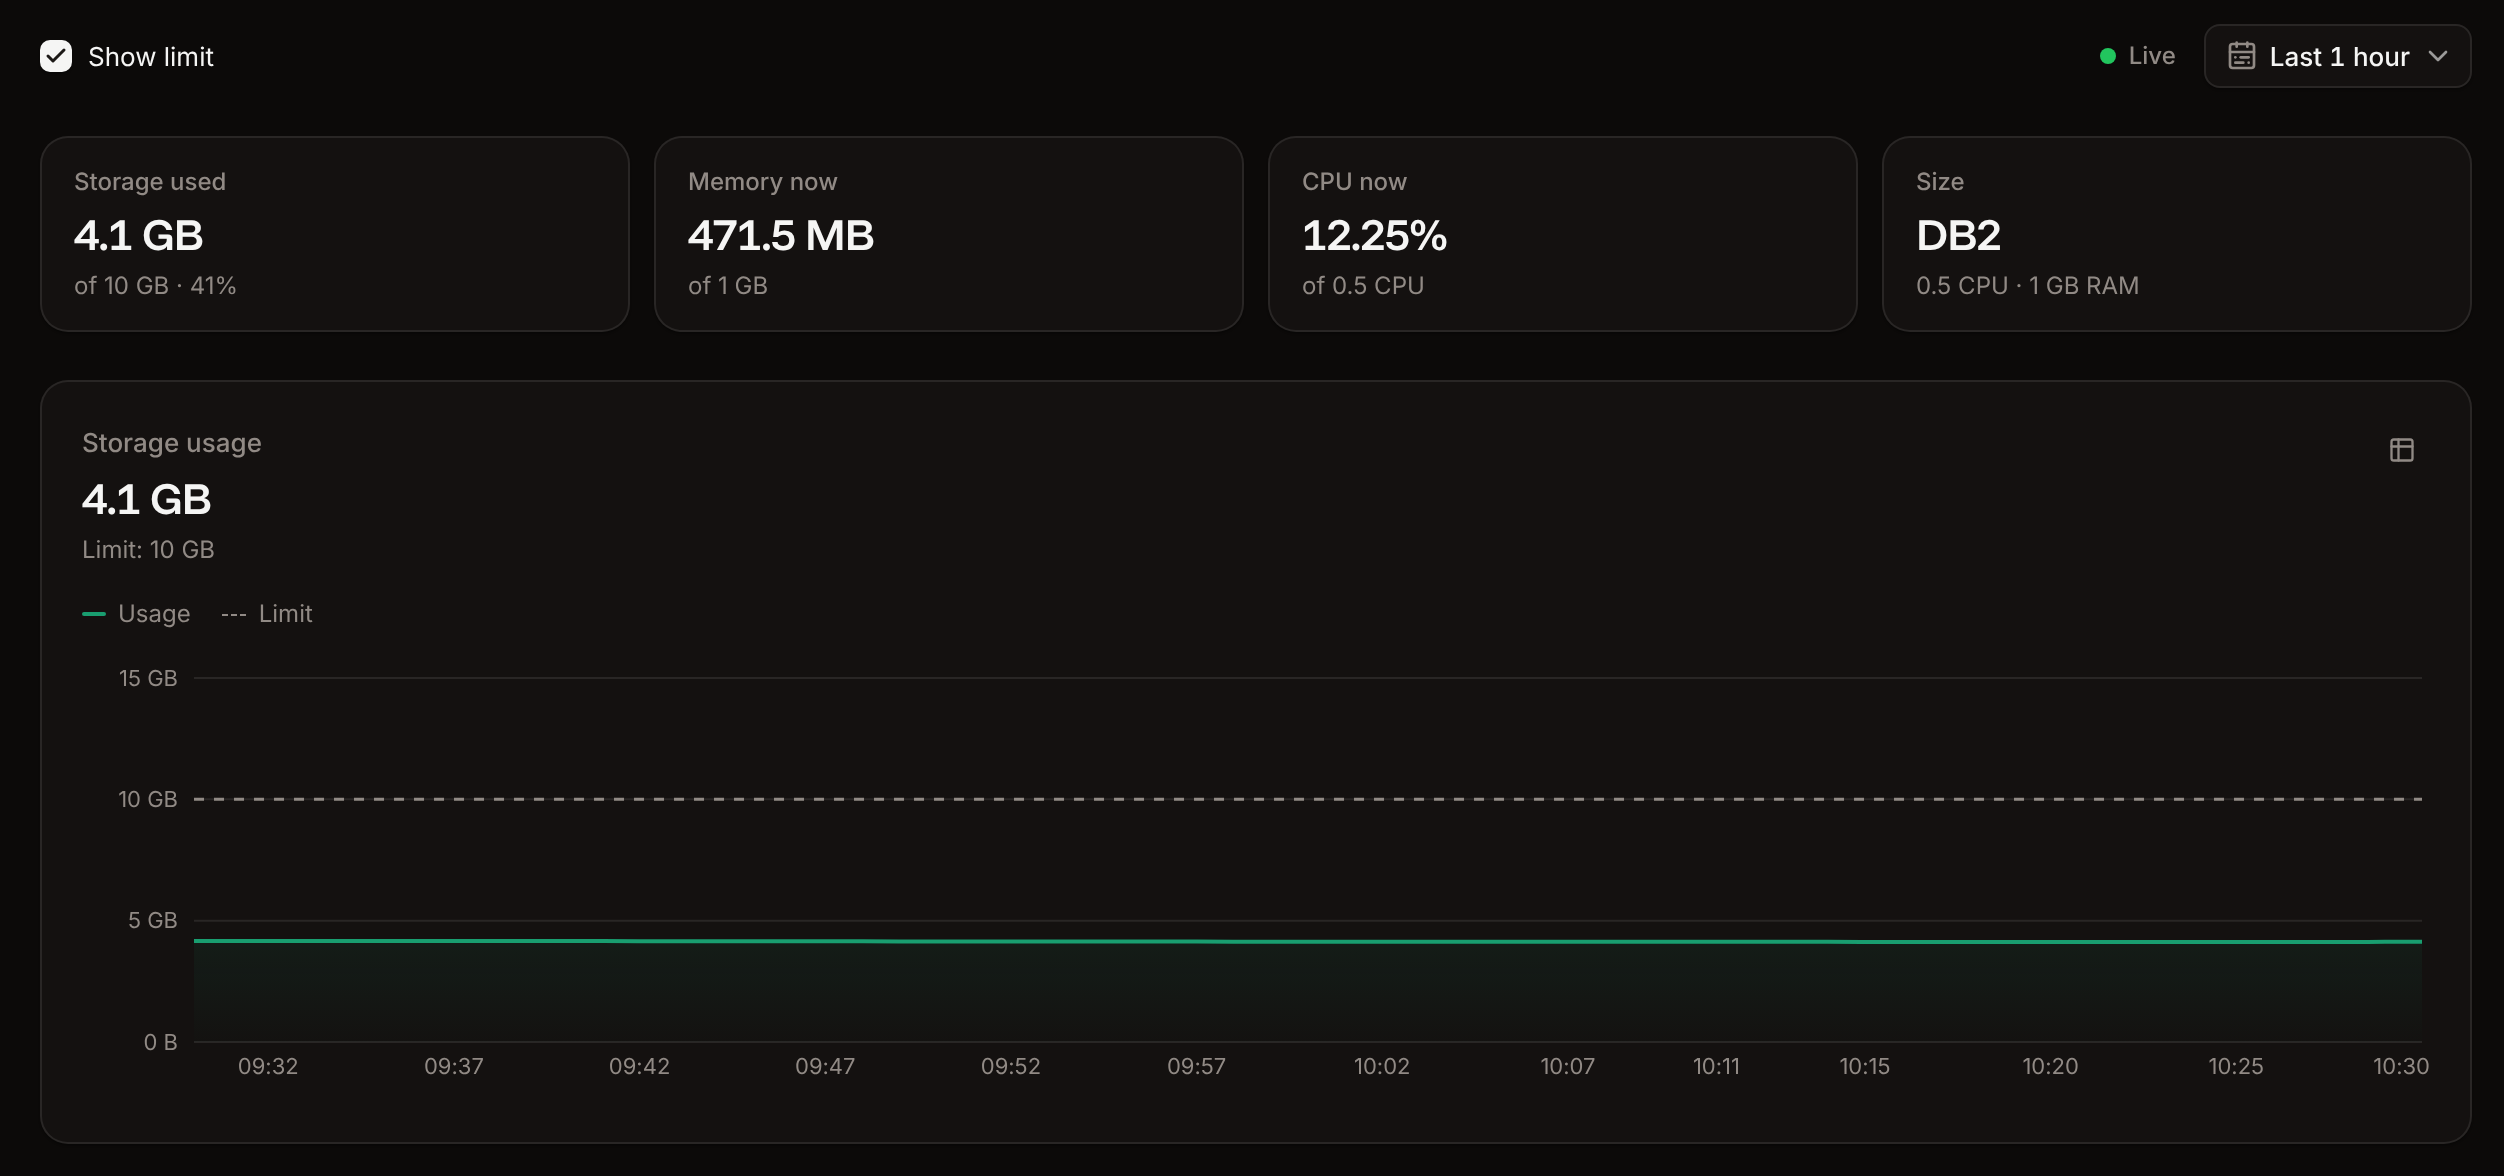
In the sidebar, click Databases, then click the database. Click the Analytics tab. The top row shows Storage used (with the percentage of the limit), Memory now, CPU now and the database’s Size. Below it are three charts: Storage usage, Memory usage and CPU usage. Each chart’s header shows its limit.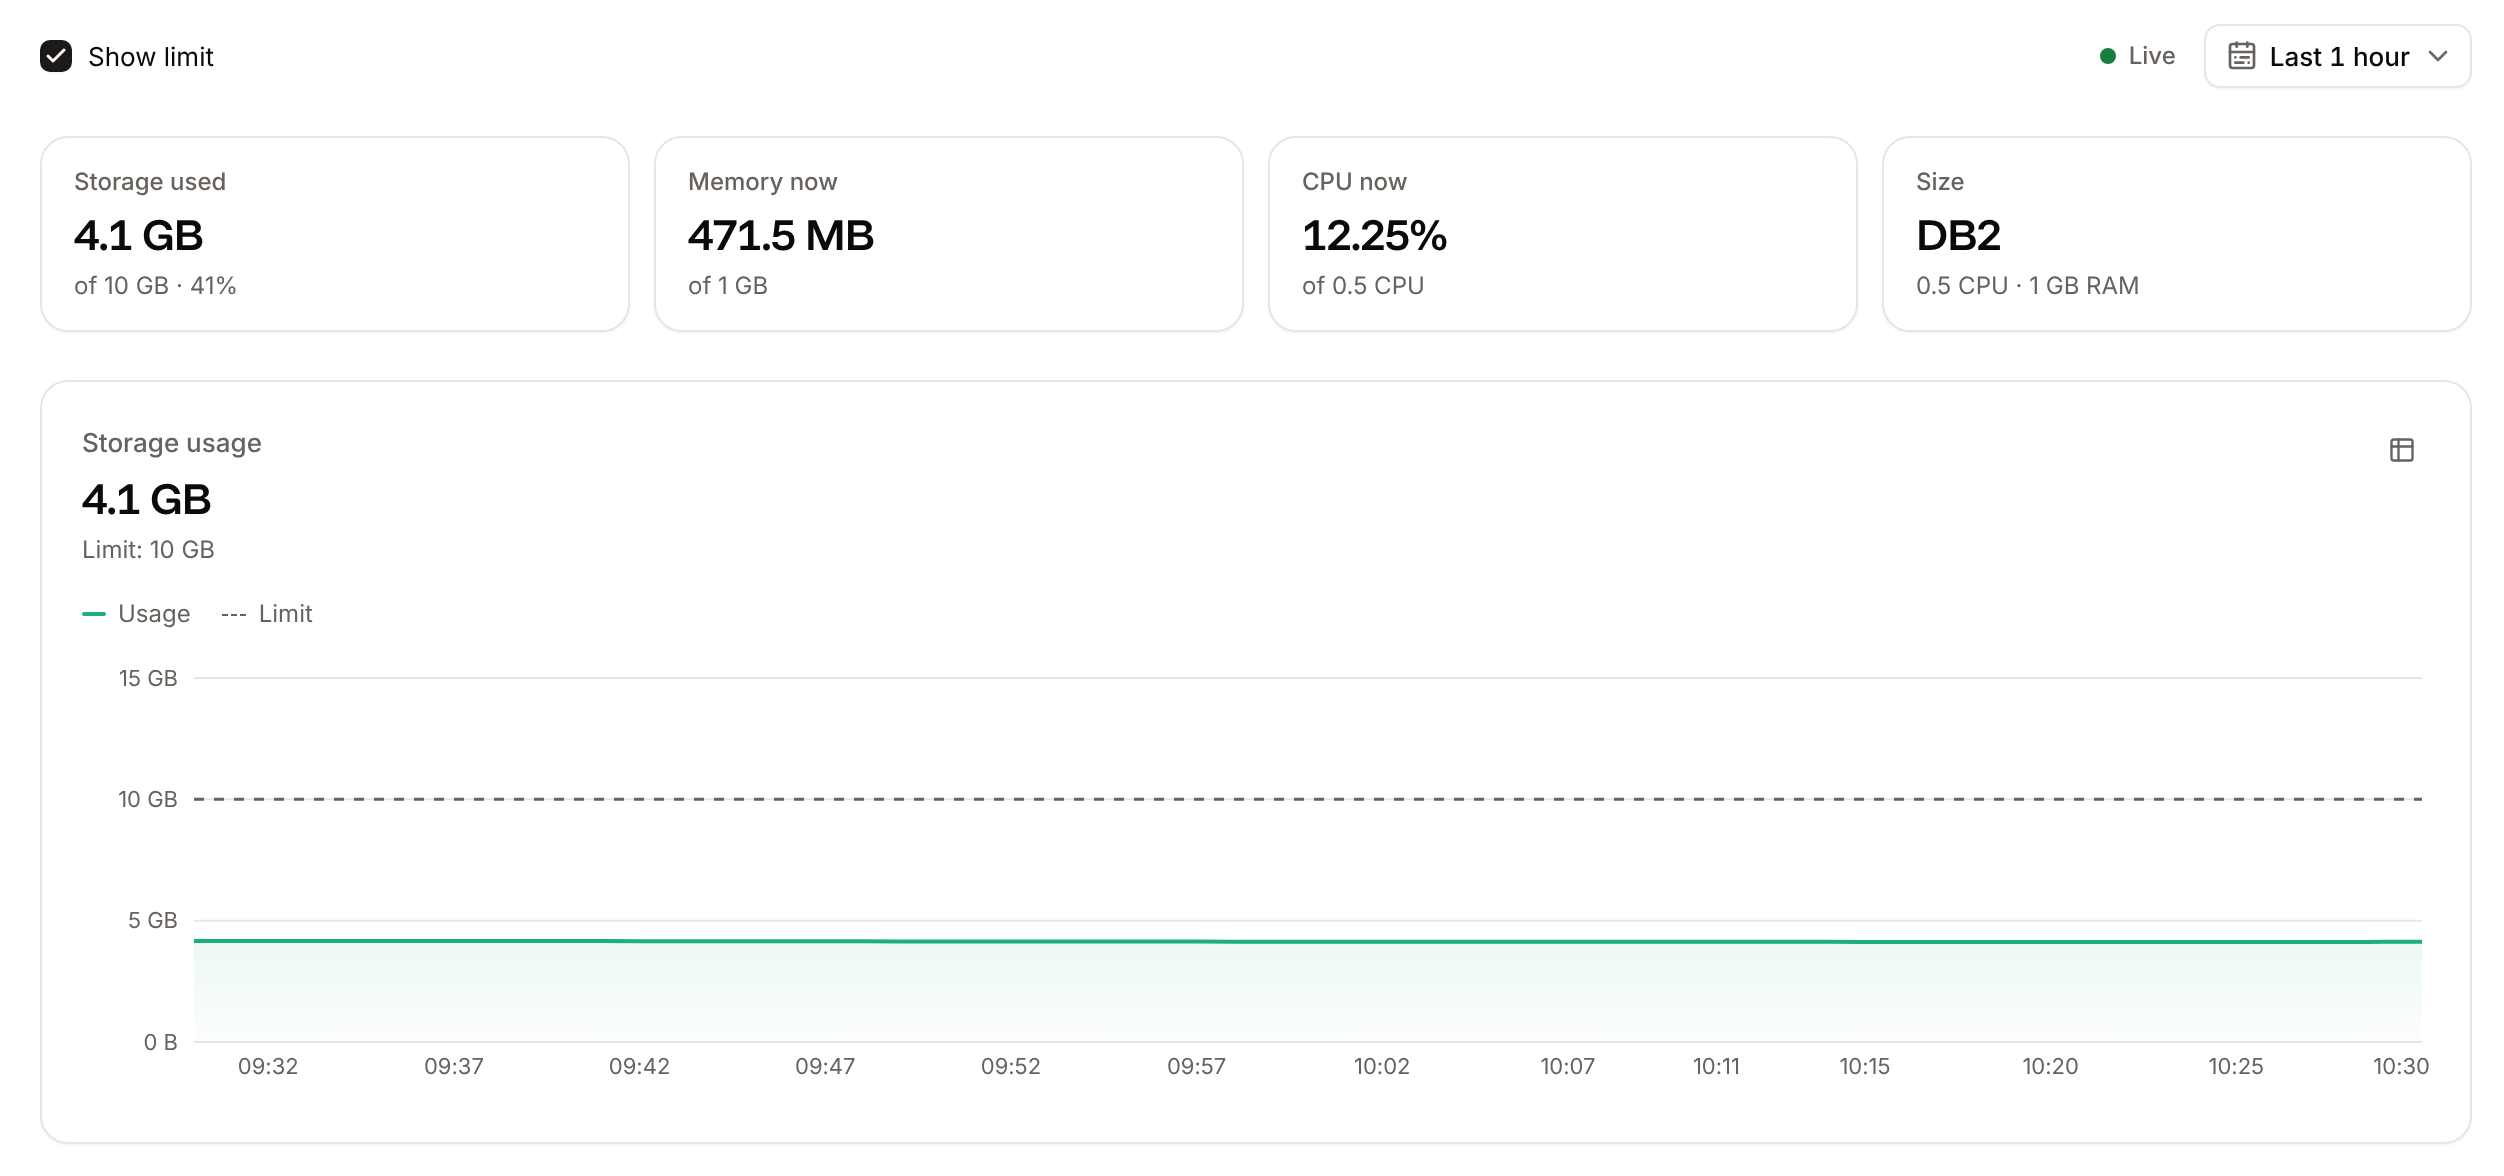
A new database’s charts fill in a few minutes after it’s created.
Choose the time range
Click the time range to pick Last 1 hour (the default), Last 6 hours, Last 12 hours, Last 1 day, Last 2 days, Last 4 days, Last 7 days, Last 14 days or Last 30 days, or set a custom range that starts up to 60 days ago. With a preset, the charts show Live and refresh on their own.- Point at a chart to see the values at that moment; the other charts mark the same moment.
- Drag across a chart to zoom into that span; every chart follows.
- Clear Show limit to hide the dashed limit lines and scale the charts to the usage alone.
Read the charts
- Storage close to the limit. When a database runs out of storage, writes fail. Storage can’t be added on its own: move to a larger size before it fills. See Storage.
- Memory close to the limit. A database that runs out of memory is stopped and restarted. Redis and Valkey in OCI locations keep data in up to 80% of the memory limit and then reject writes with an out-of-memory error (they don’t evict keys). Move to a larger size, or reduce what the database keeps in memory, for example by setting expiries on cache keys. MySQL and MariaDB need at least DB2 under production load.
- CPU close to the limit. Queries slow down when the CPU stays at its limit. Look for slow queries (the Redis studio has a slow log), or move to a larger size.