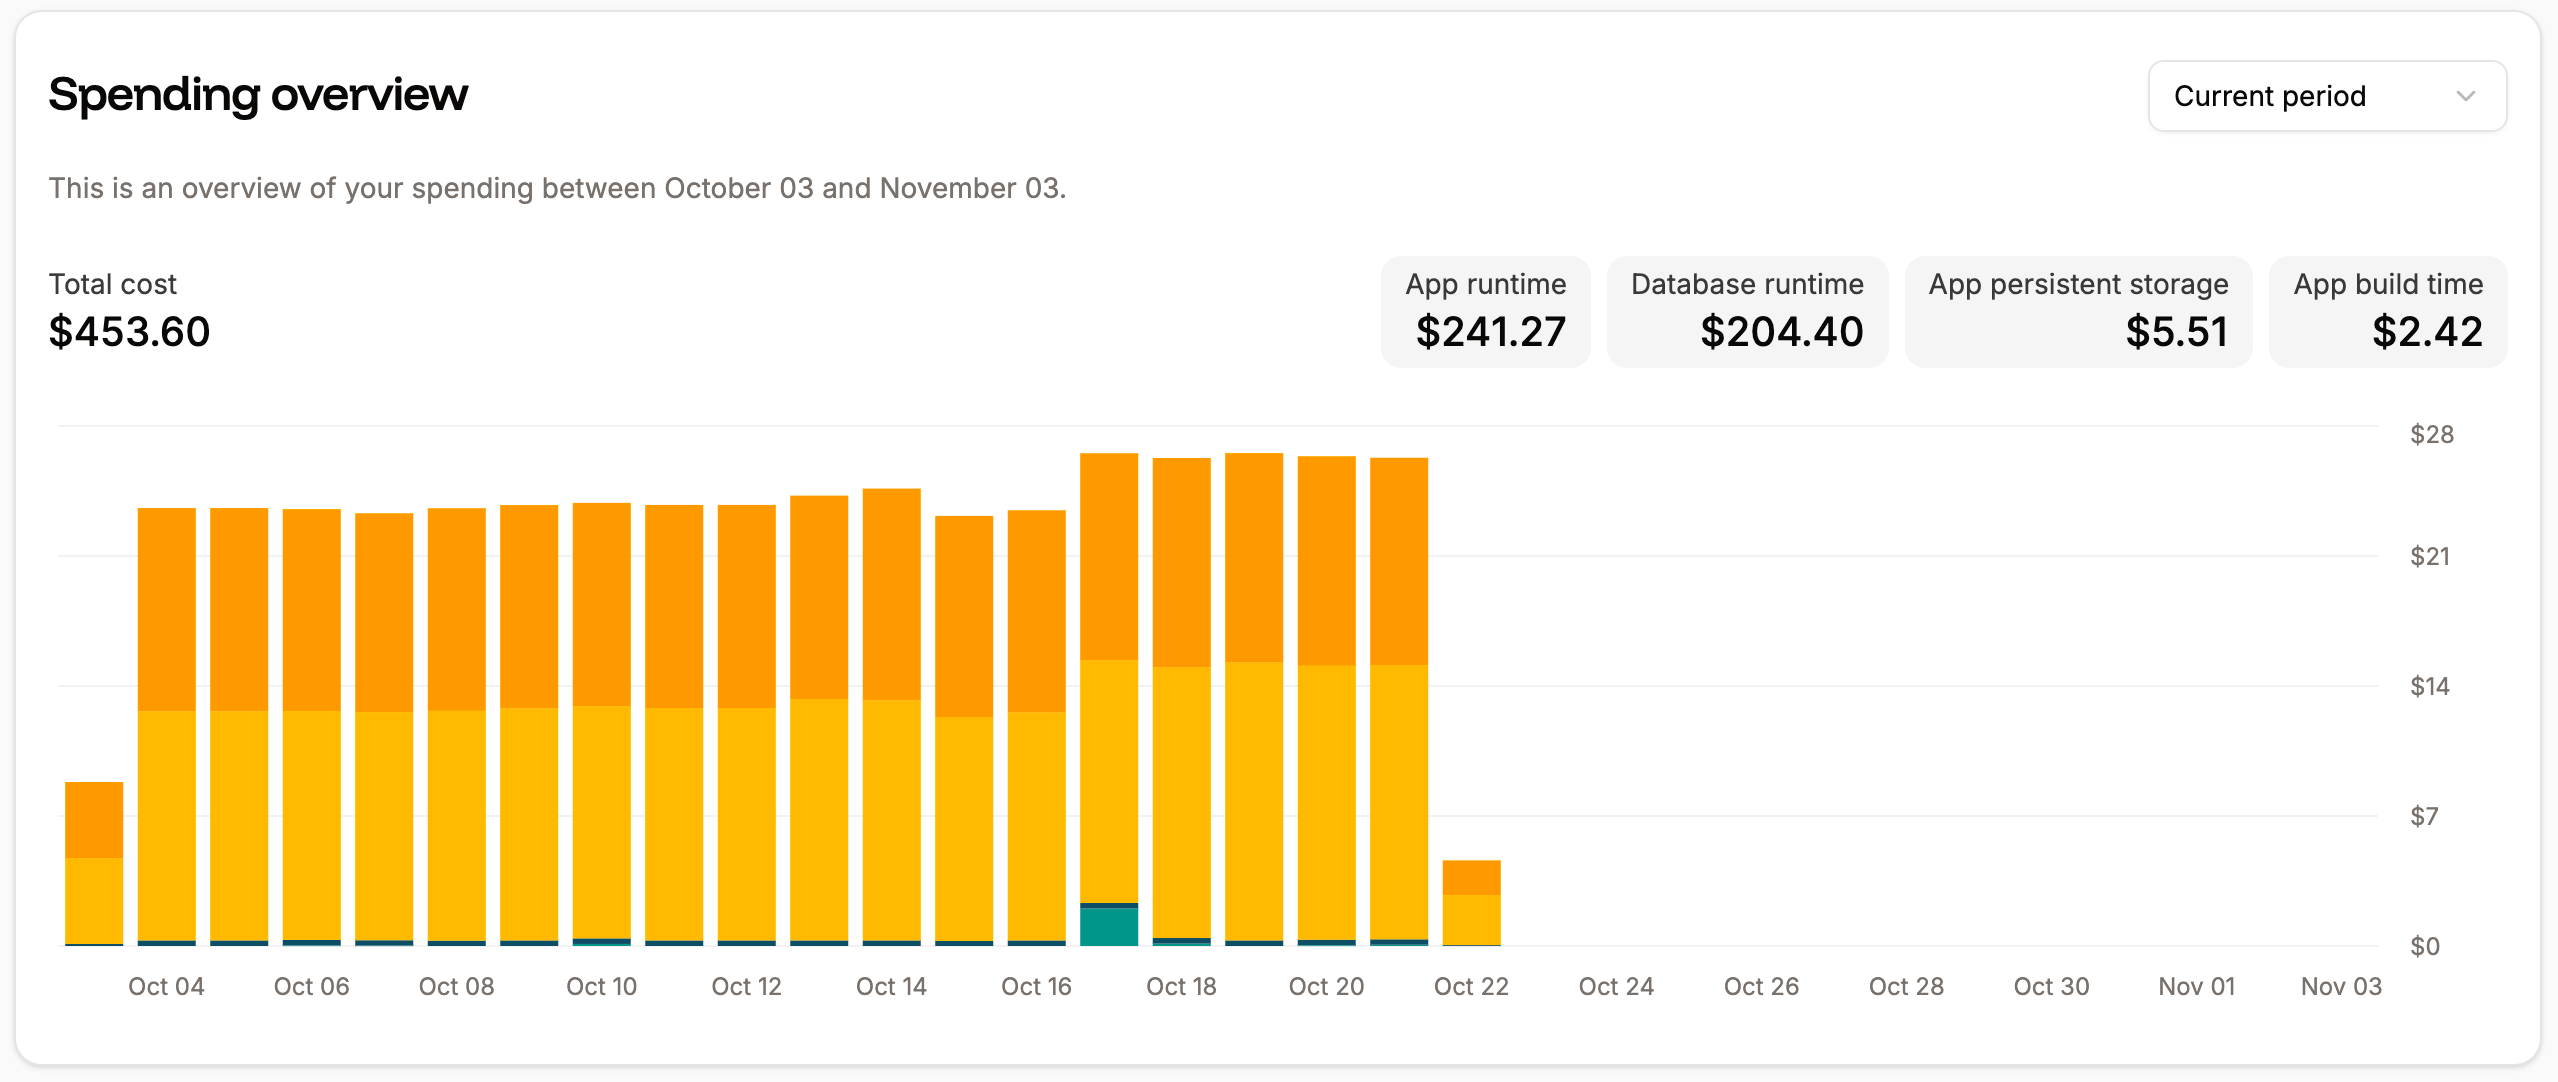
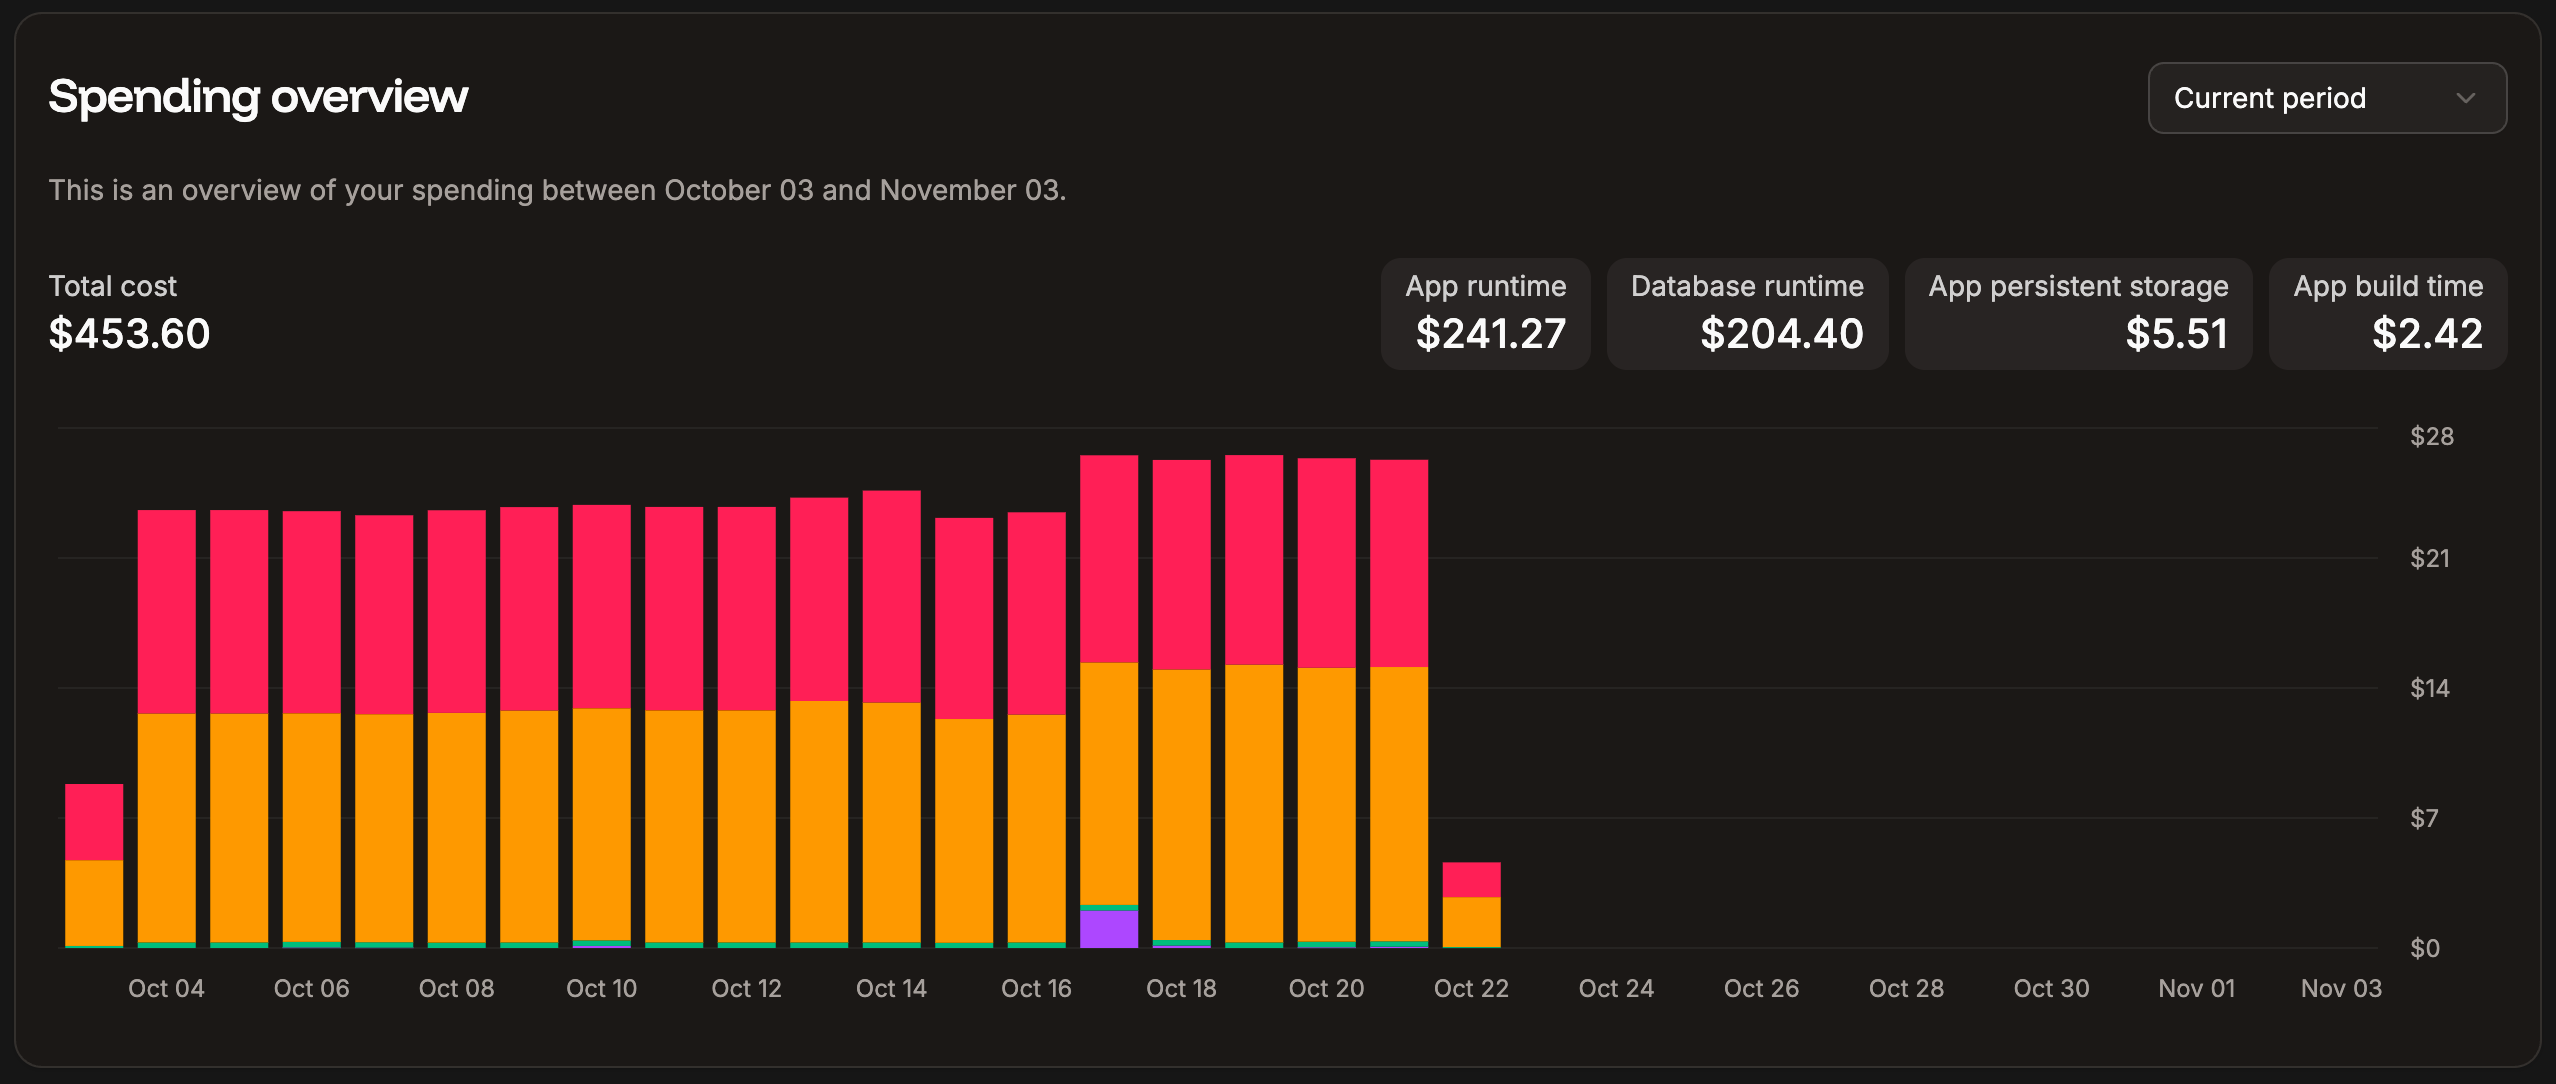
Spending overview for your Sevalla services on your Sevalla Dashboard.
- Source IP
- Country
- Device type
- HTTP method
- Path
- User agent
- HTTP version
- Status code
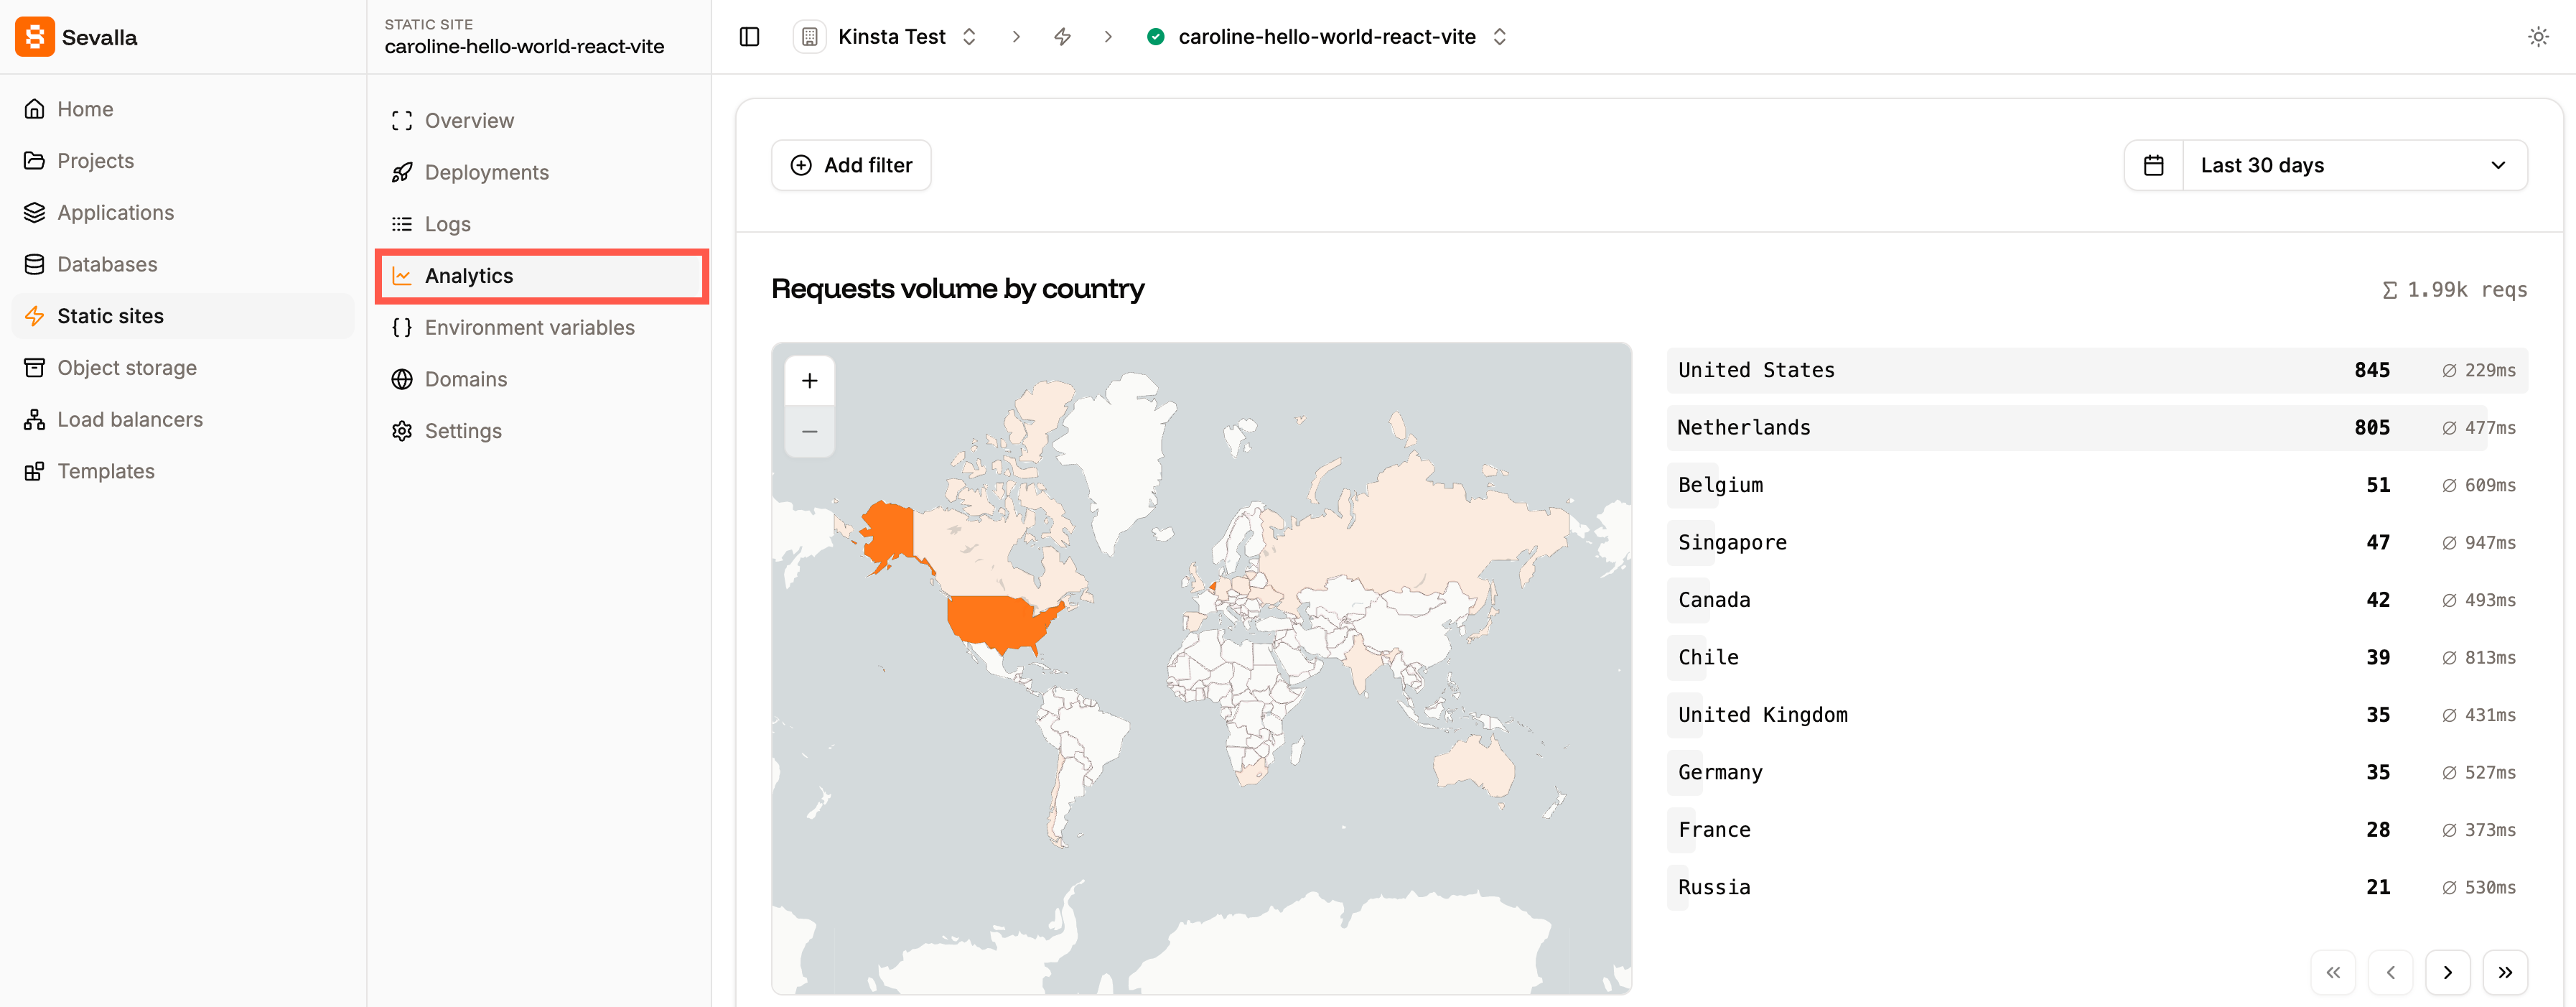
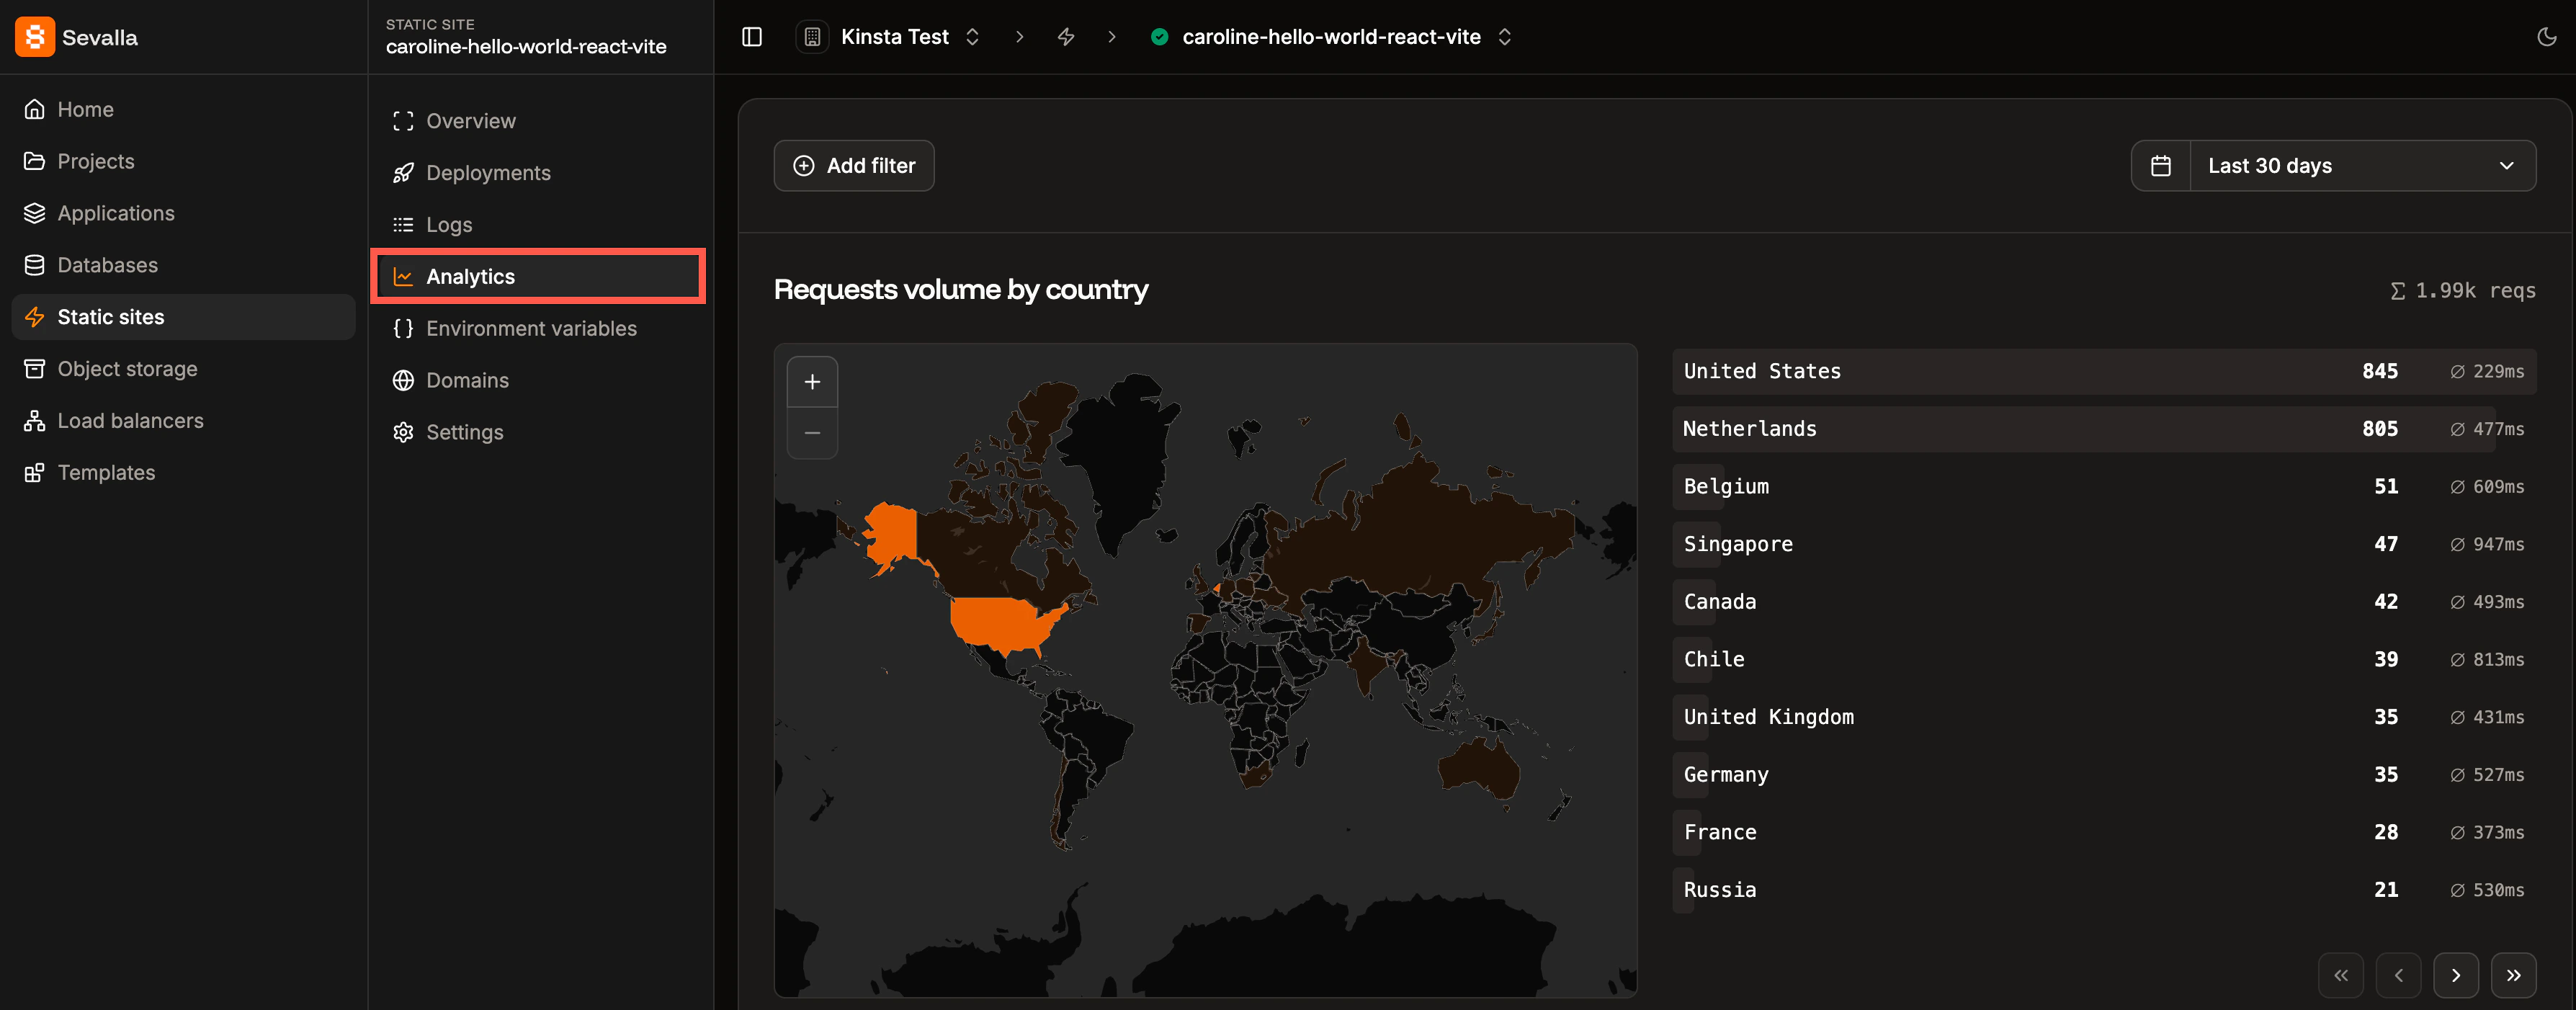
Static site Analytics page.
Requests volume by country
The Requests volume by country chart displays the number of requests, ranked by the country from which they originated. You can zoom in and out of the map, and hover over a country to see the exact number of requests from that location. You can also filter the chart to include or exclude specific countries.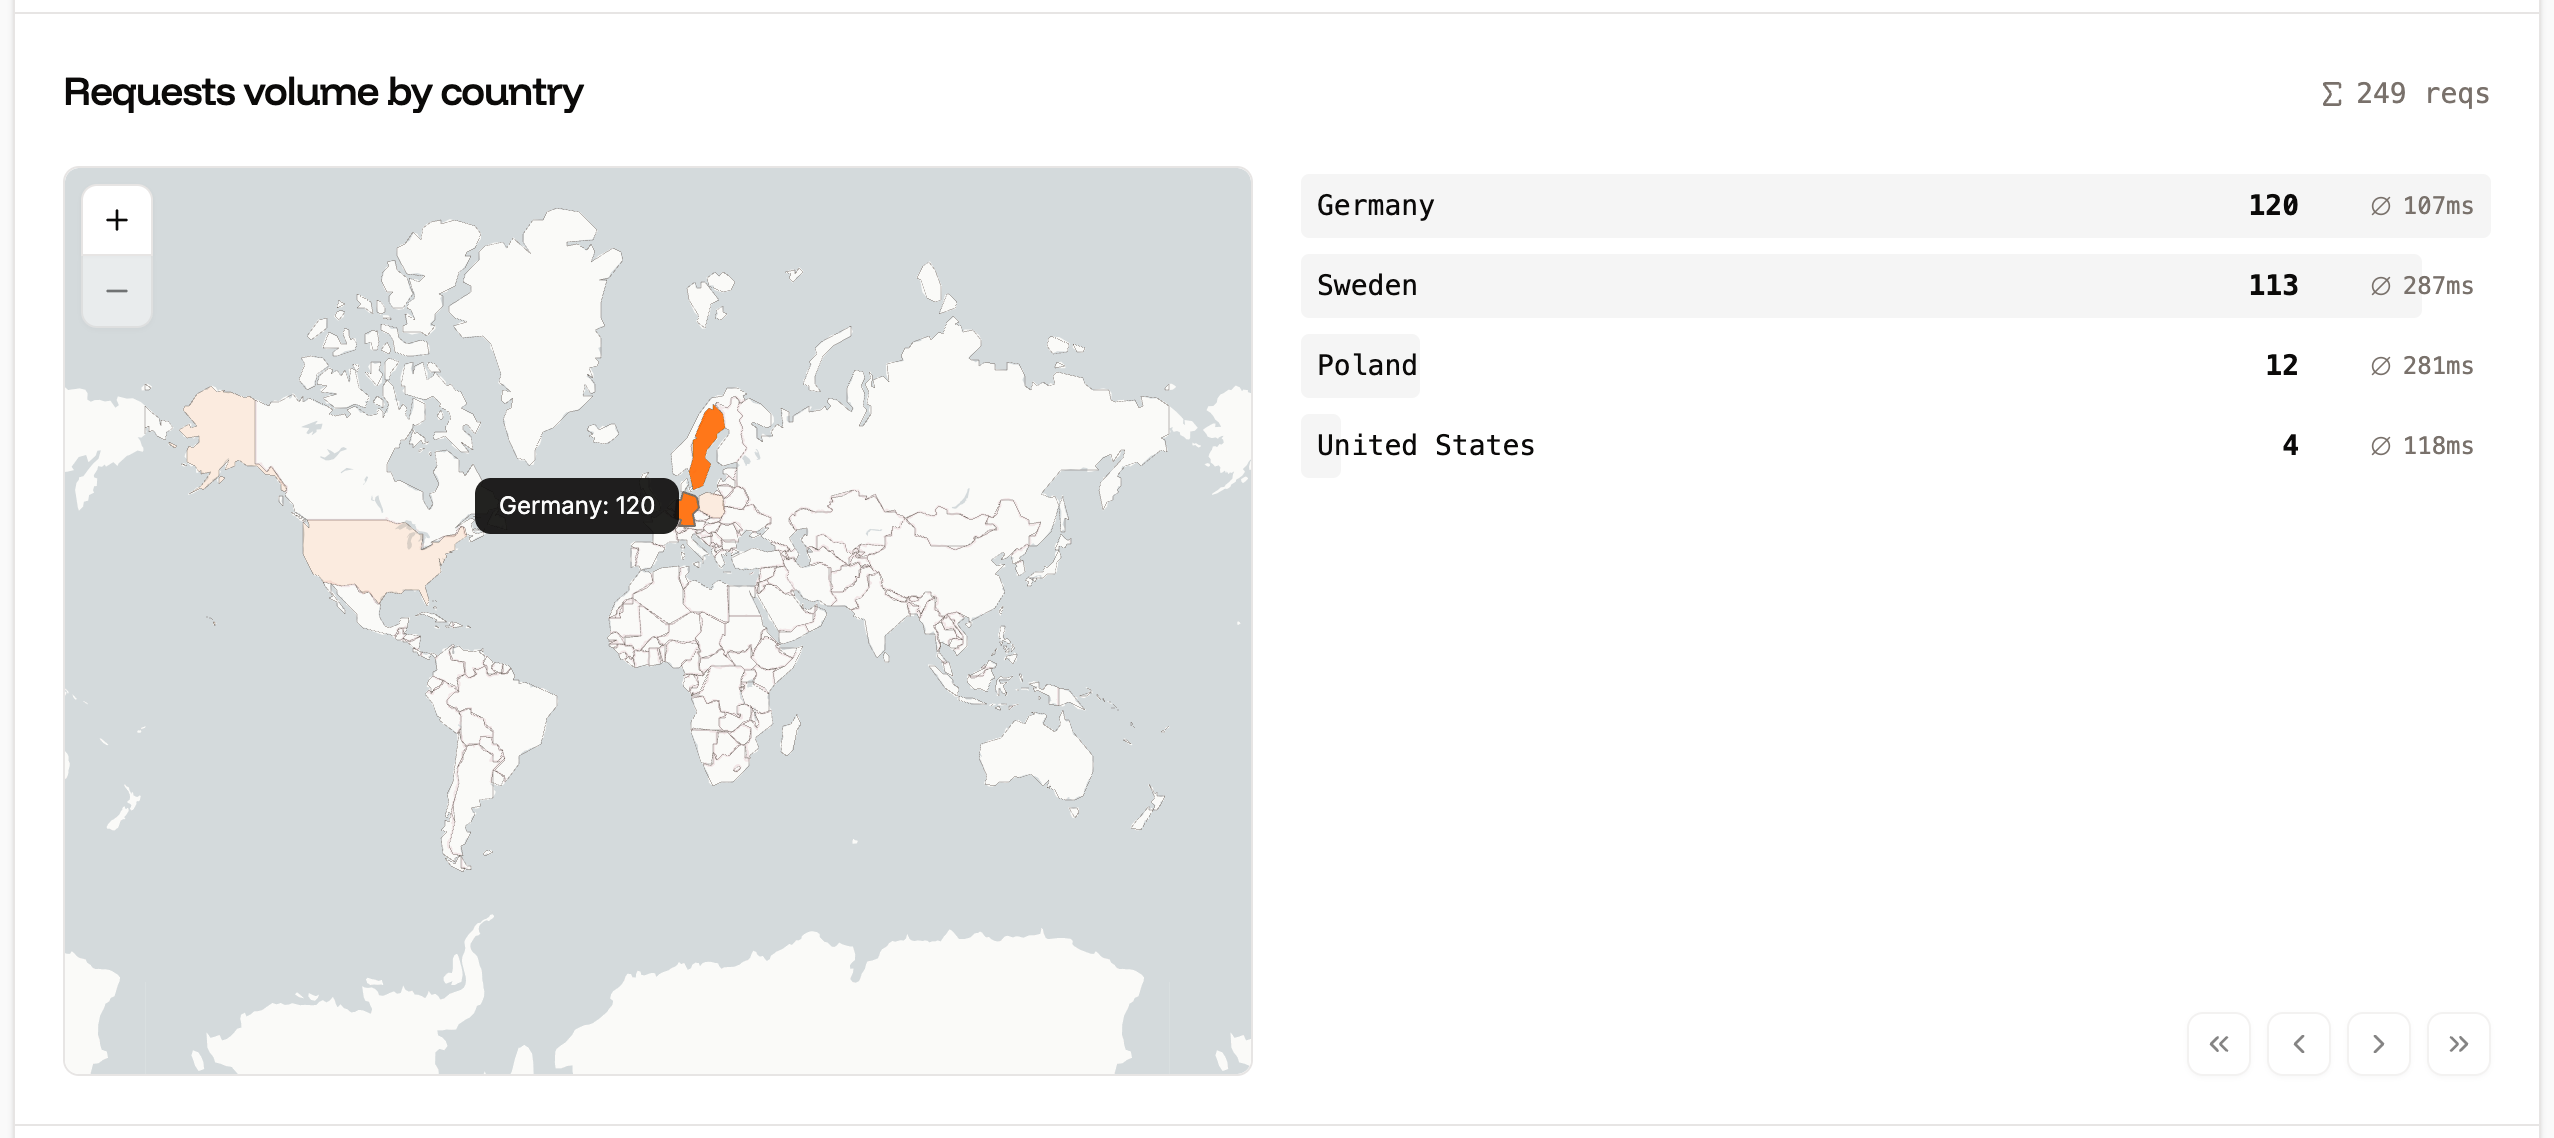
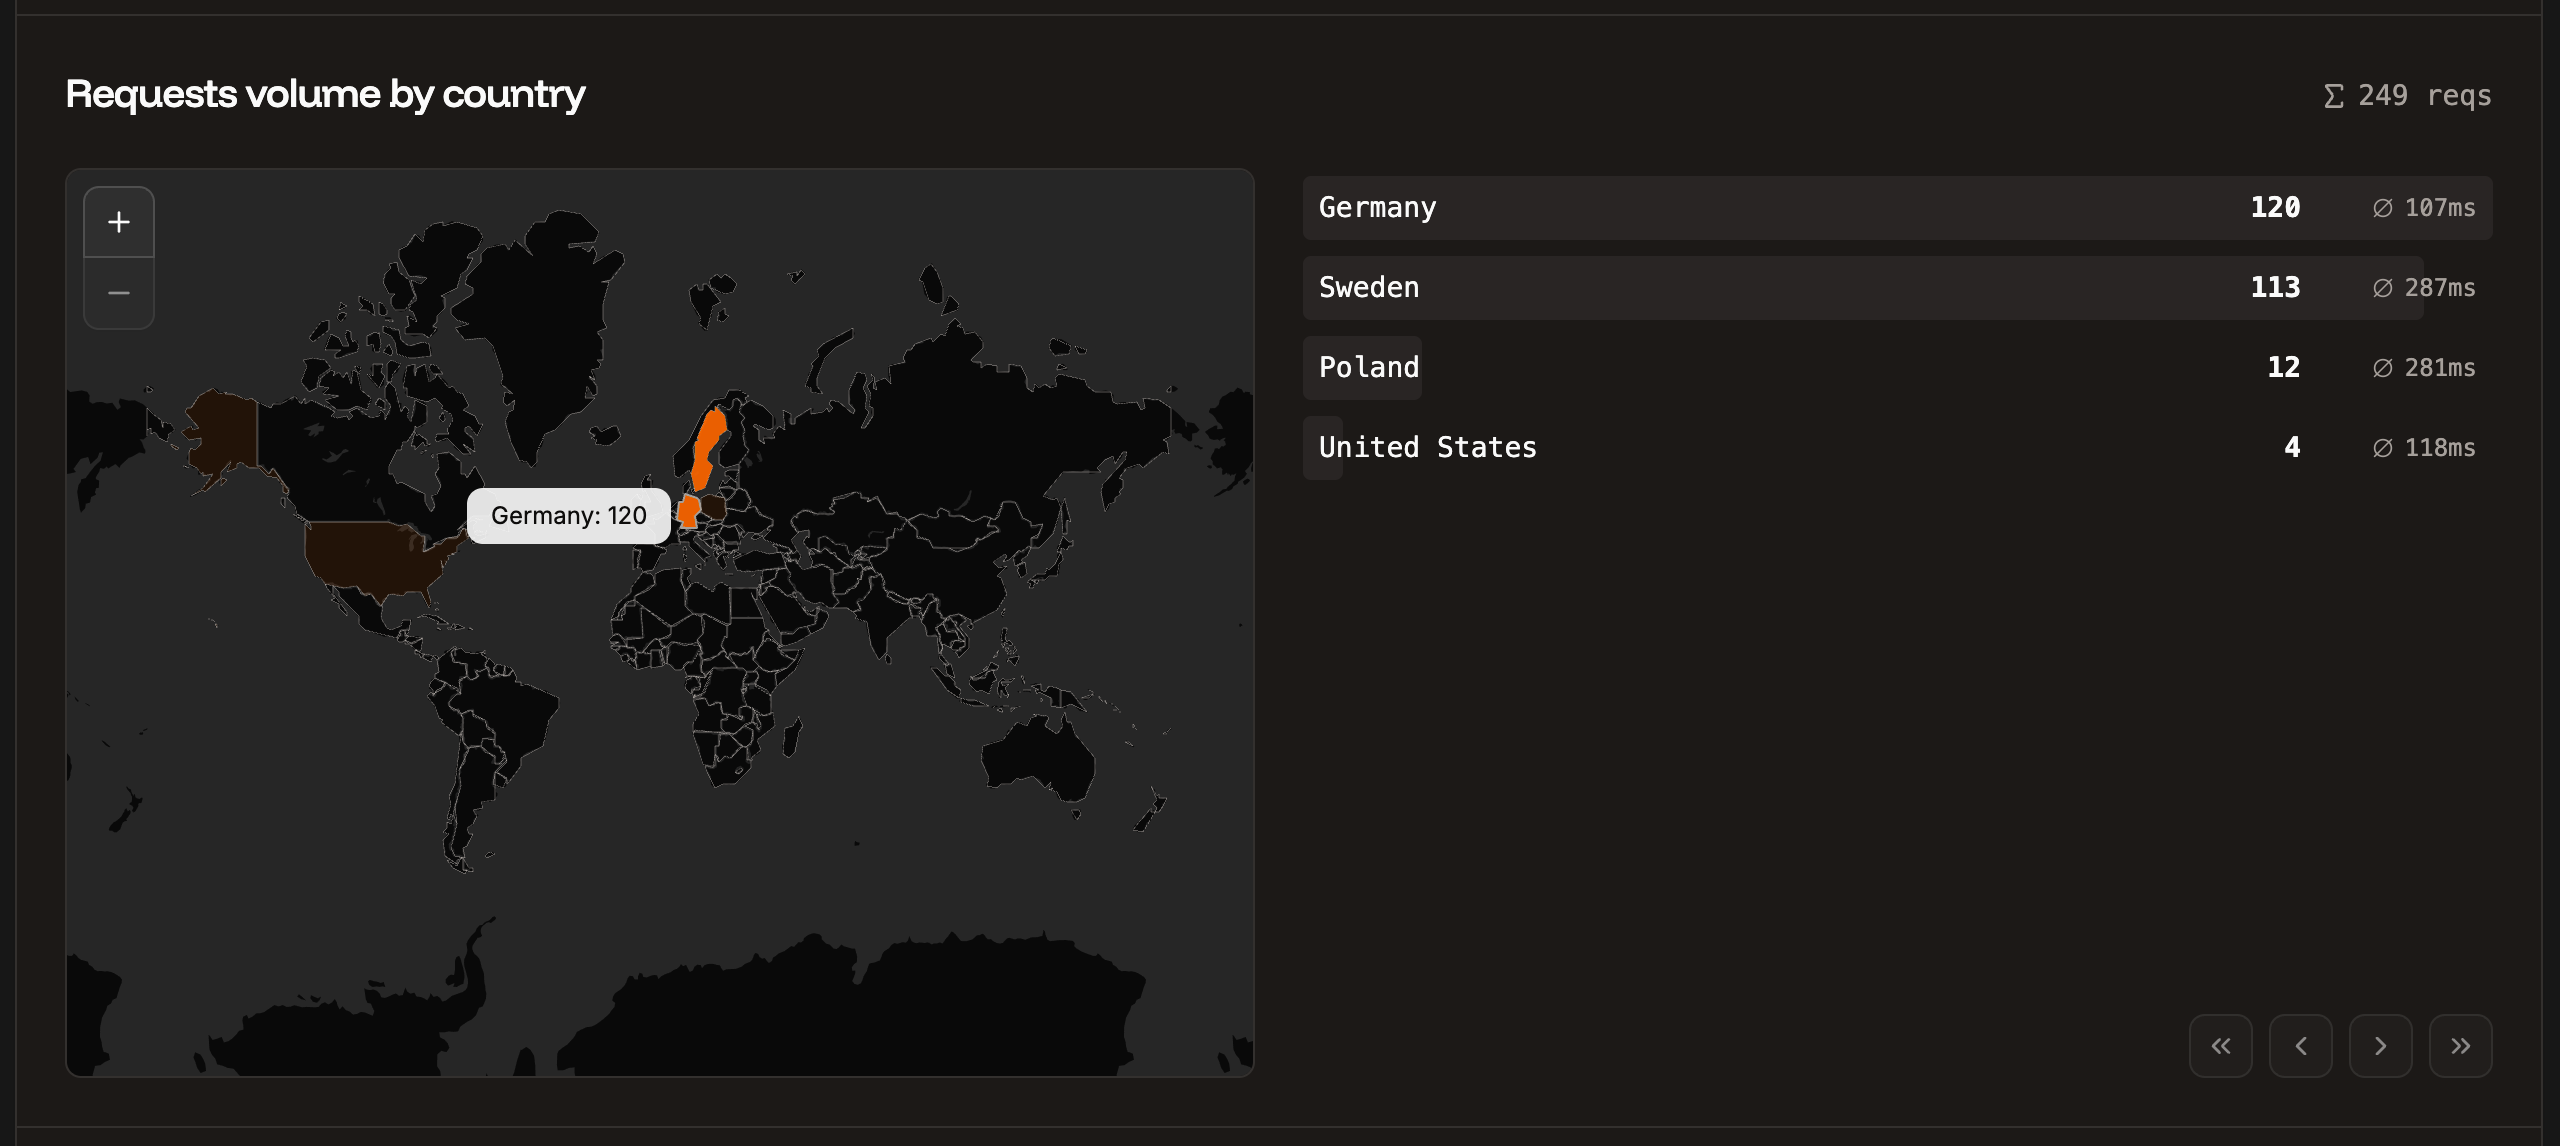
Requests volume by country chart.
Requests per minute
The Requests per minute chart shows the average number of HTTP requests per minute (RPM) of all HTTP requests for the time period selected.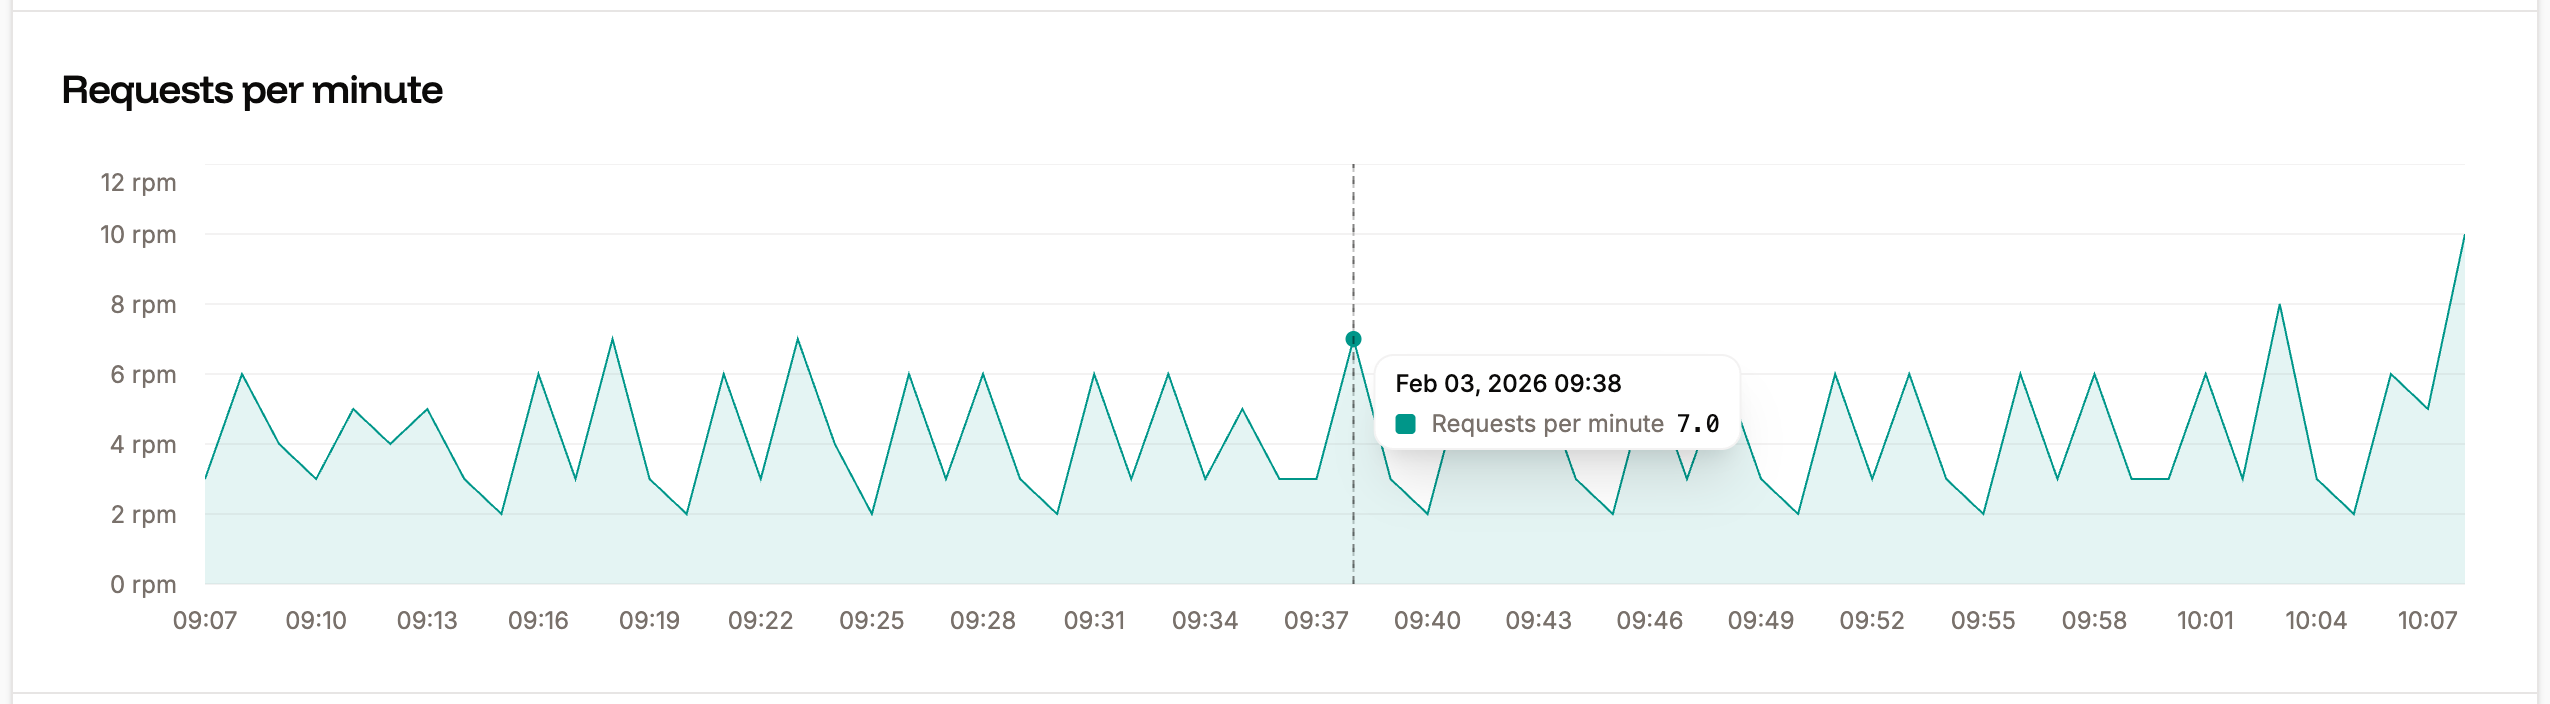
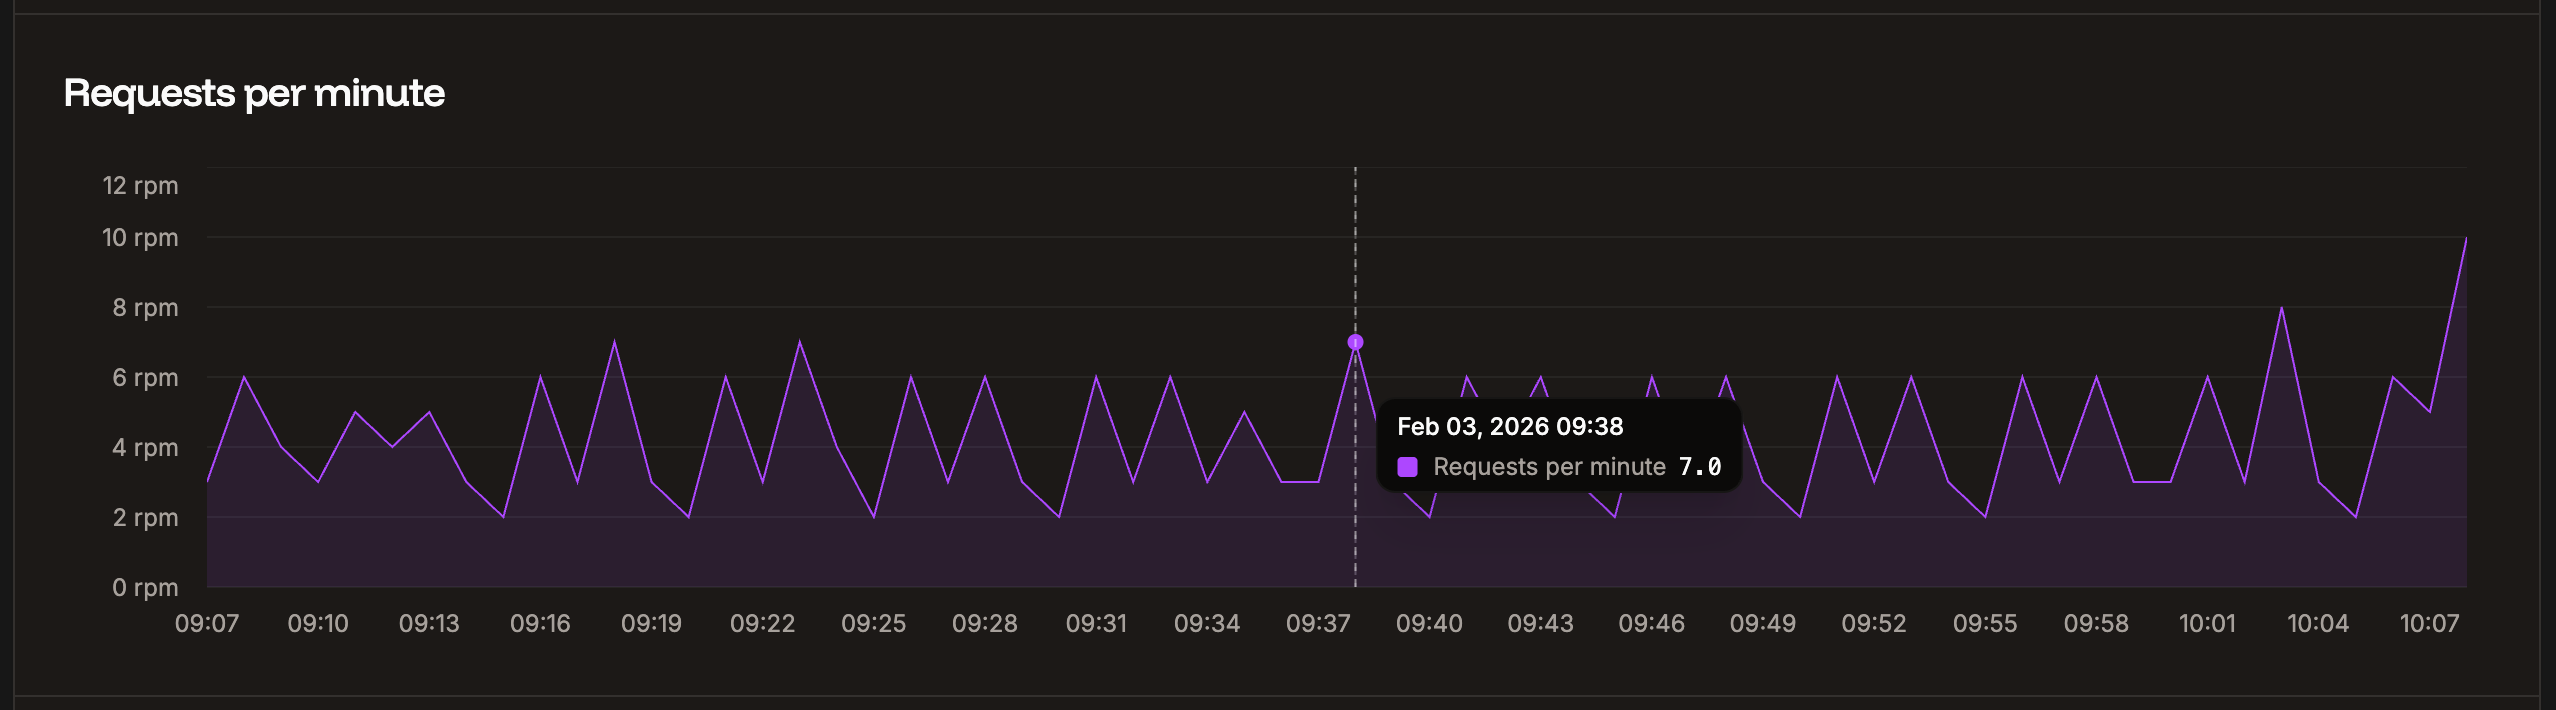
Requests per minute chart.
Bandwidth
The Bandwidth chart shows your bandwidth usage over the selected timeframe.

Bandwidth chart.
Response time
The Response time chart shows the average response time for all HTTP requests for the time period selected.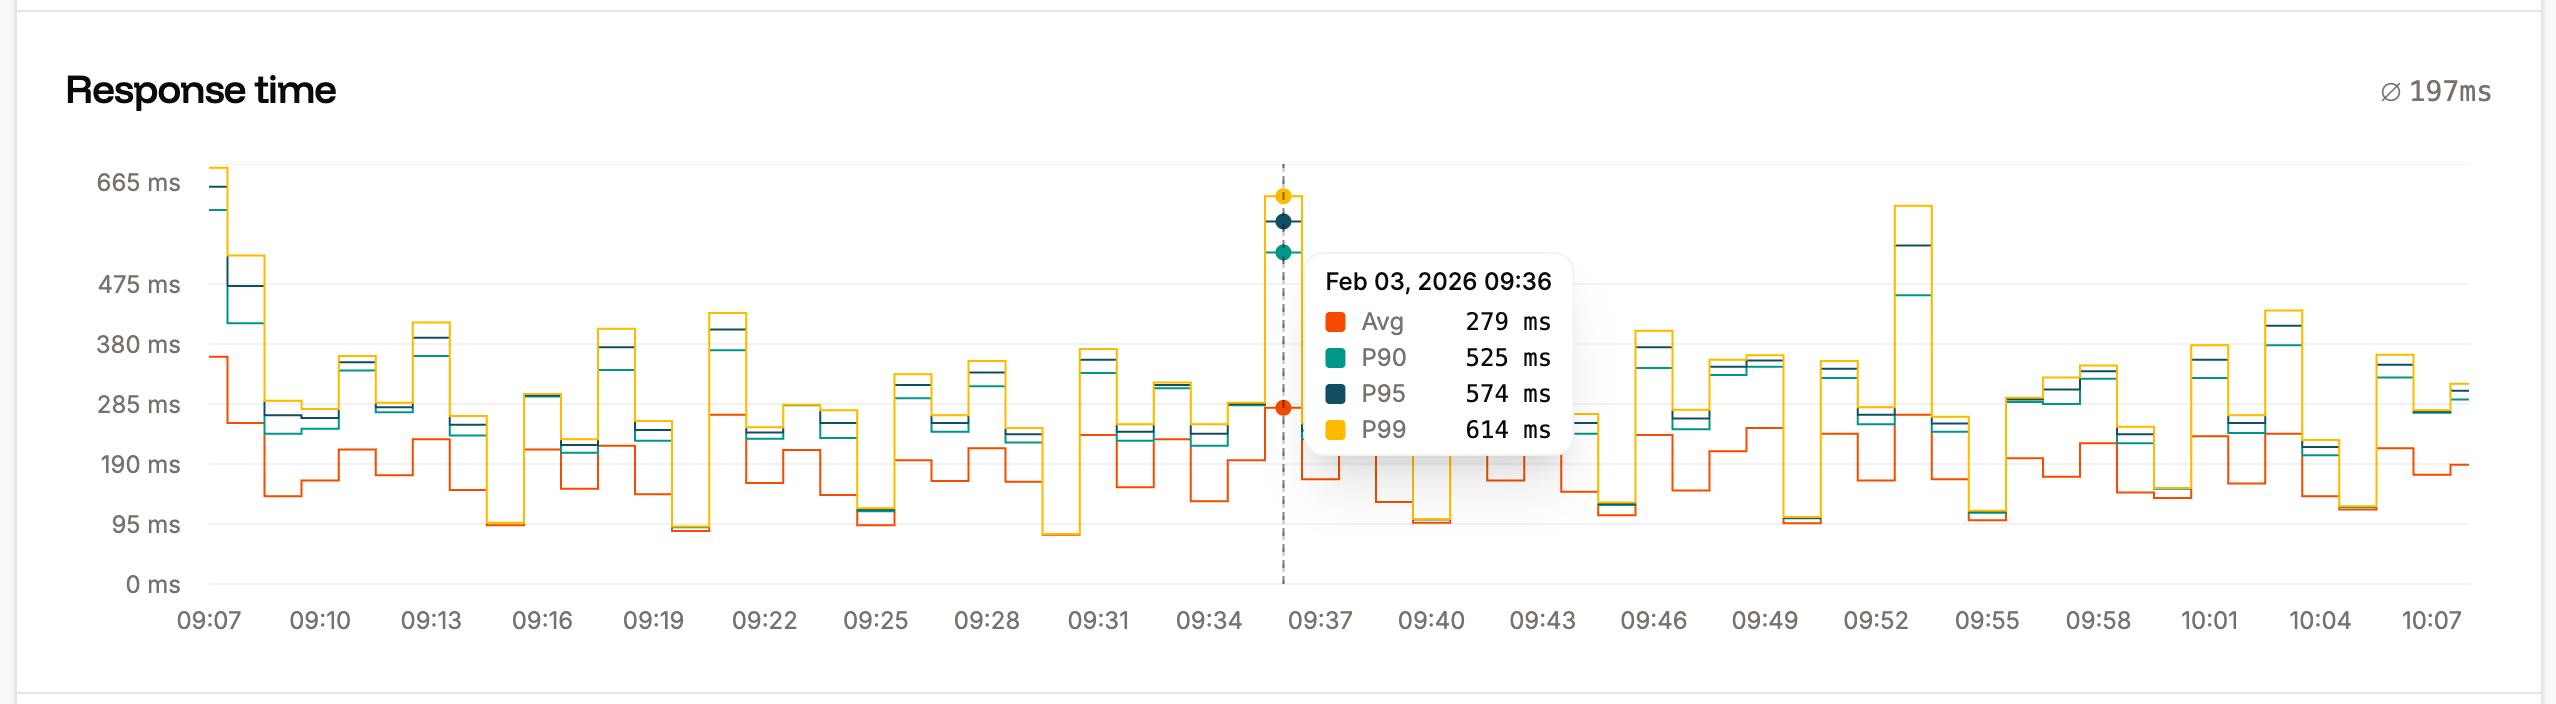
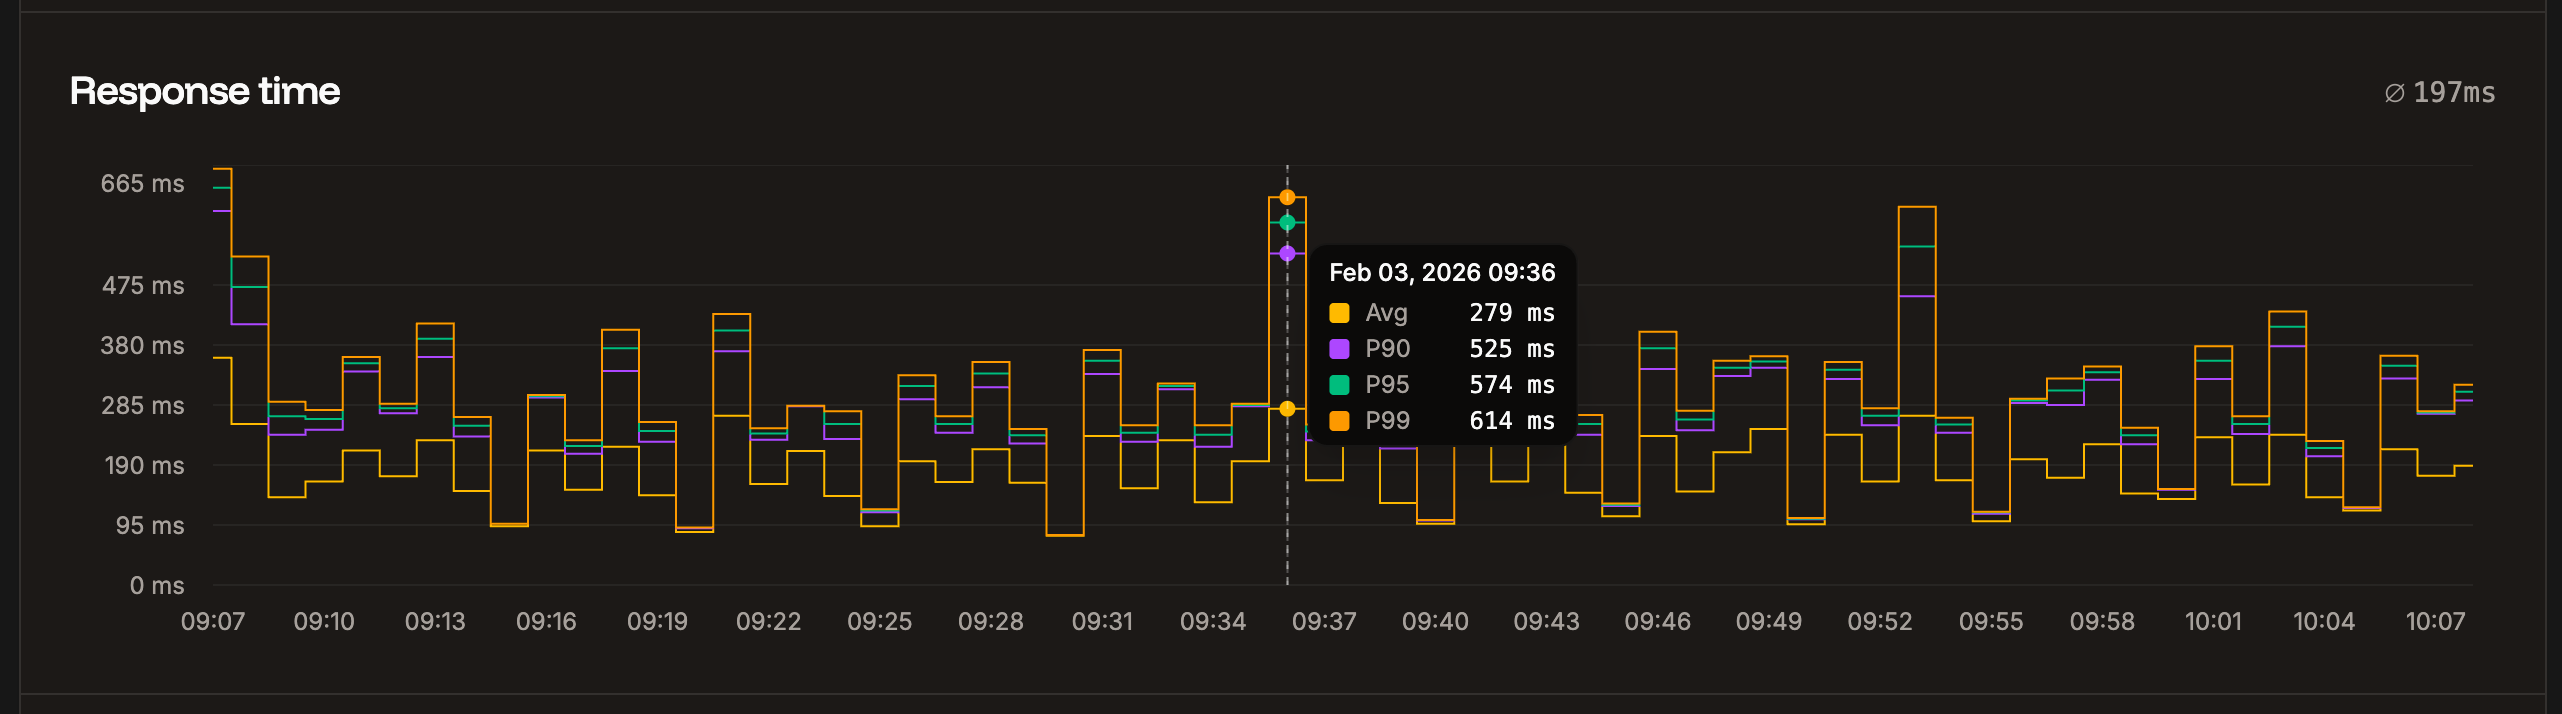
Response time chart.
Status codes
The Status codes chart displays the total number of each status code returned for requests. This is useful for analyzing your site to identify when requests return codes other than 200.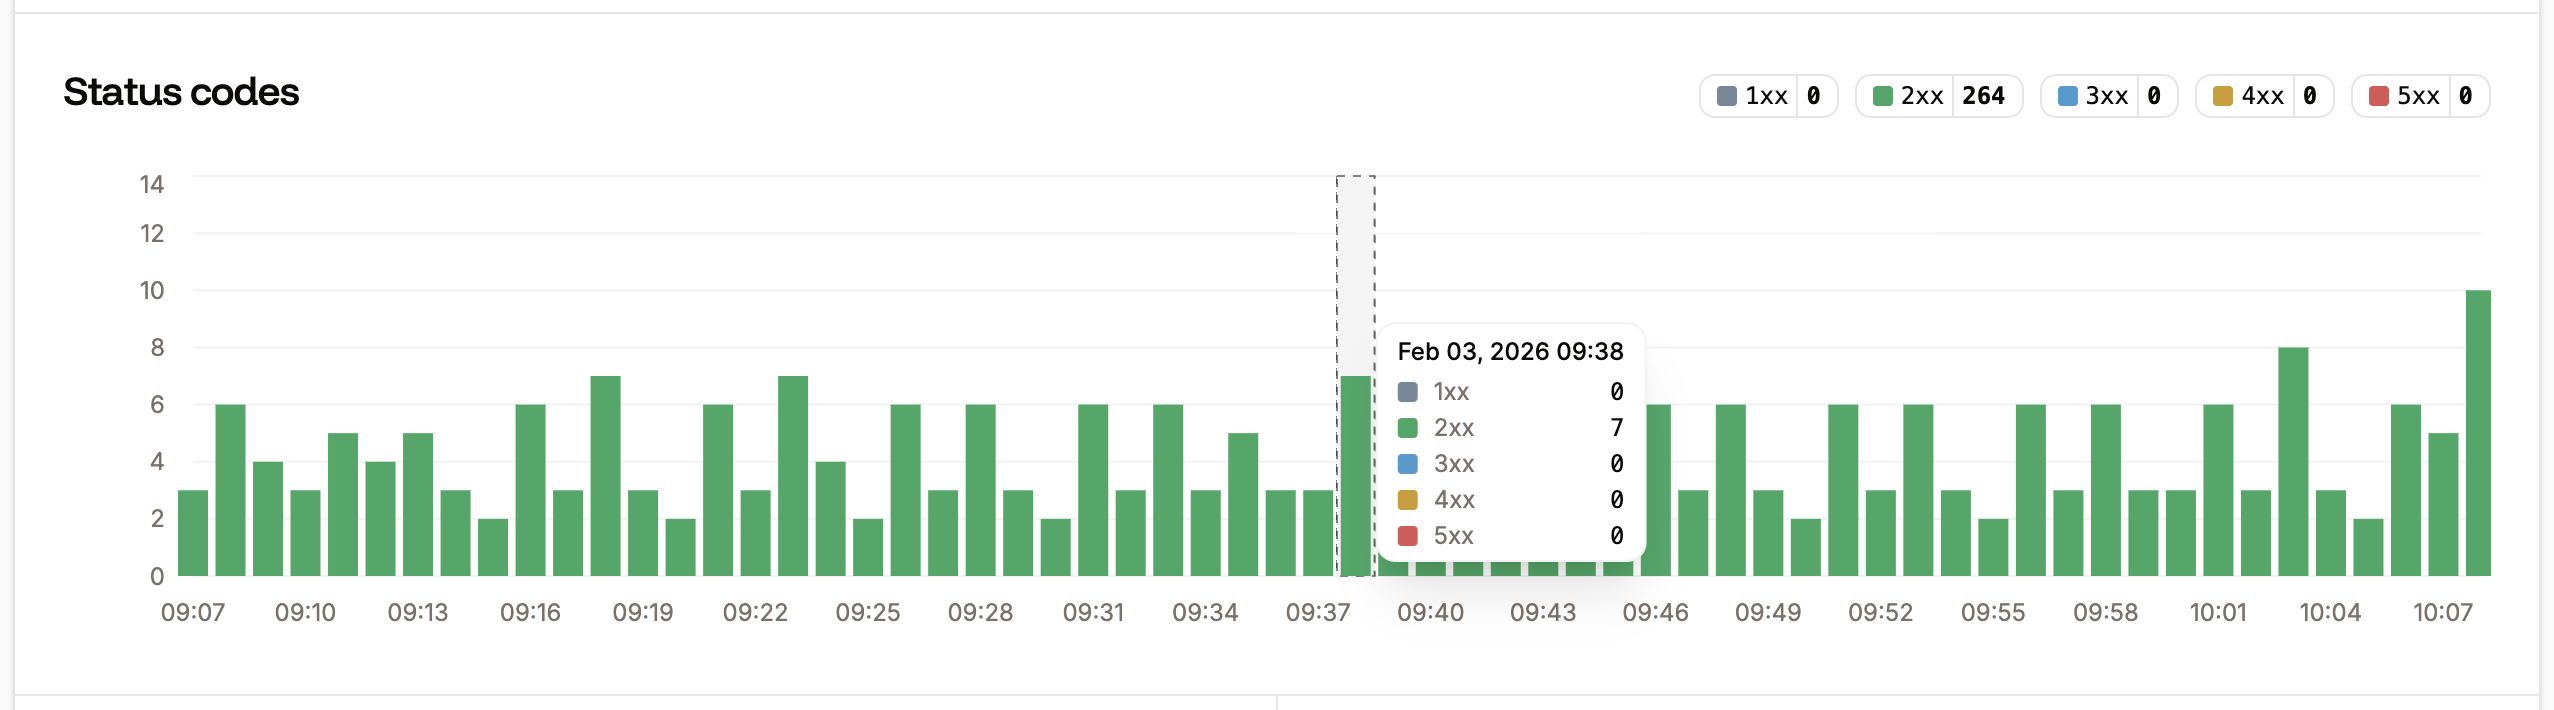
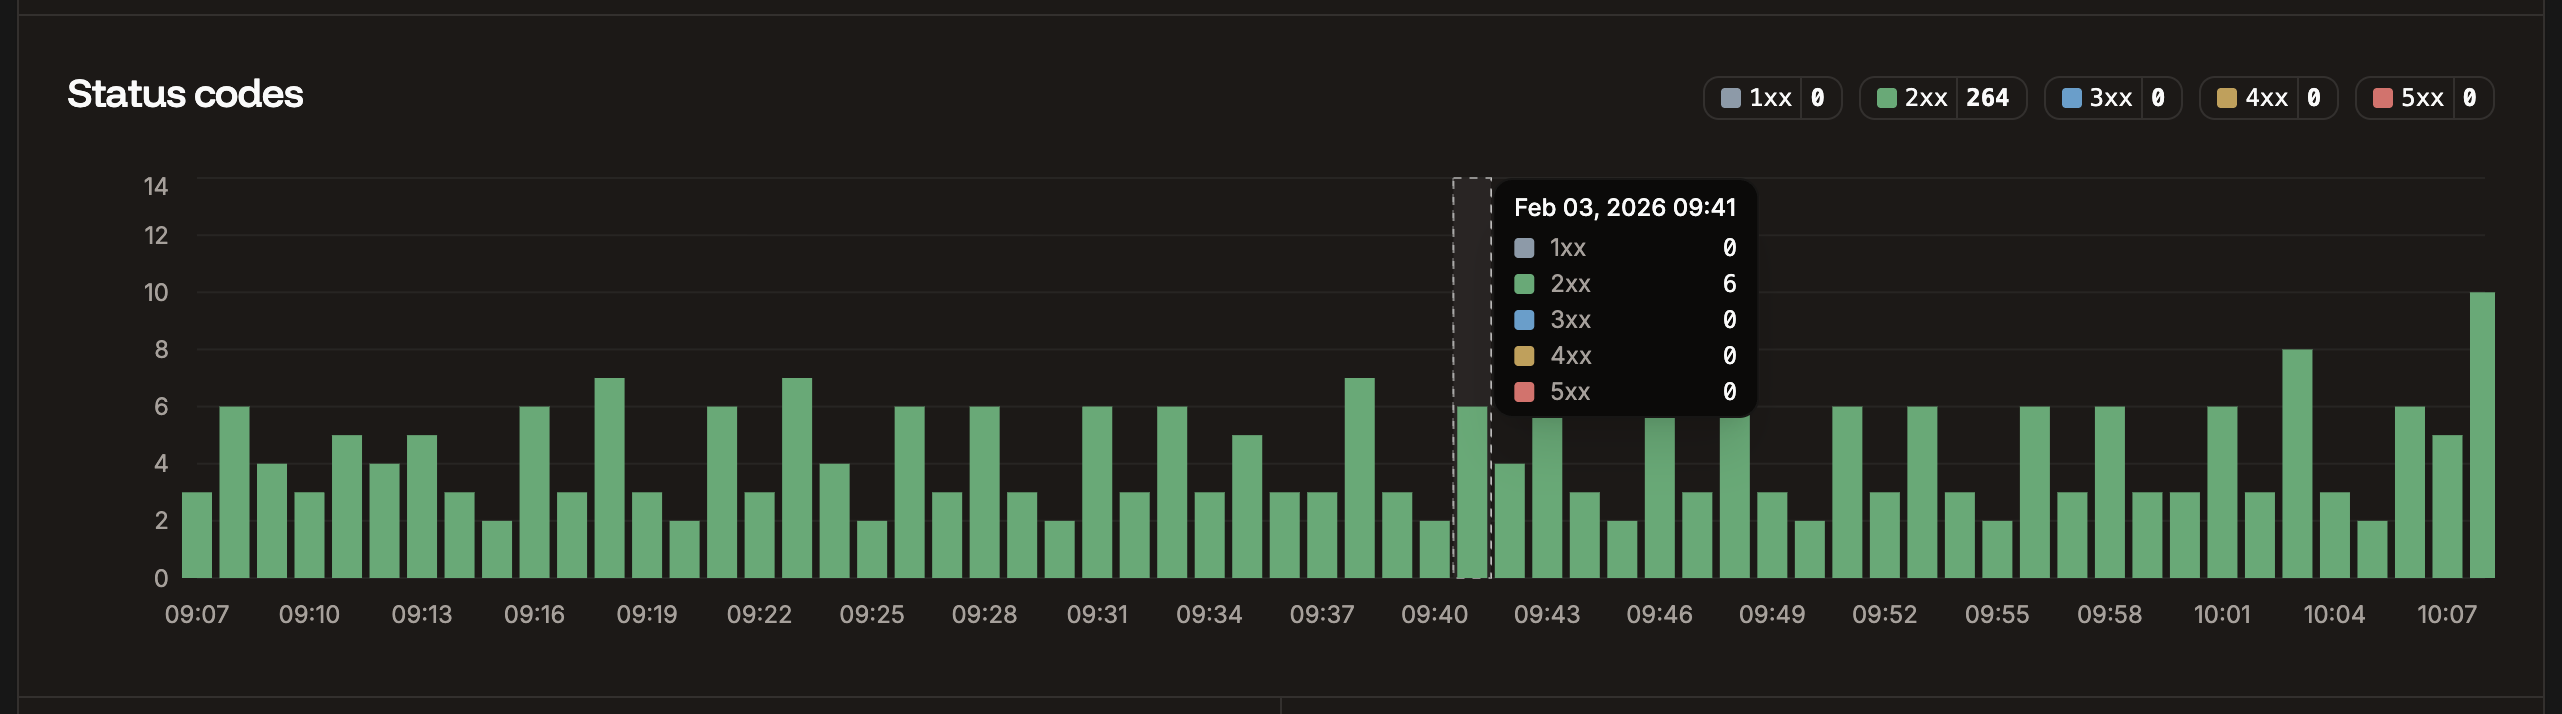
Status codes chart.
Slowest requests
The Slowest requests table shows the 10 slowest requests to your site for the selected time period and the average response time it took to complete.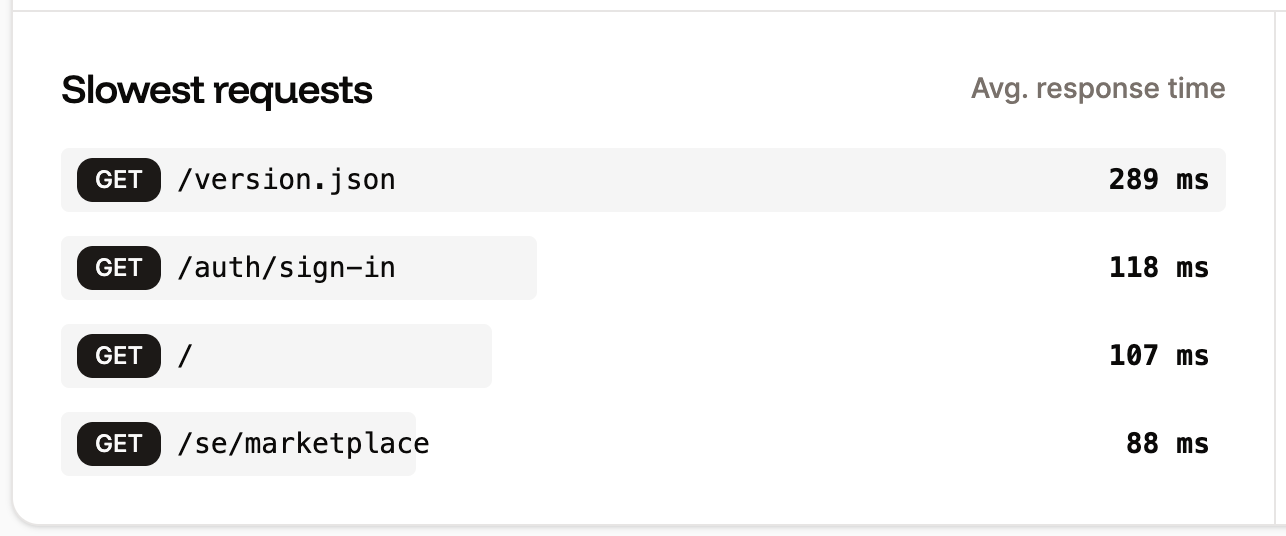
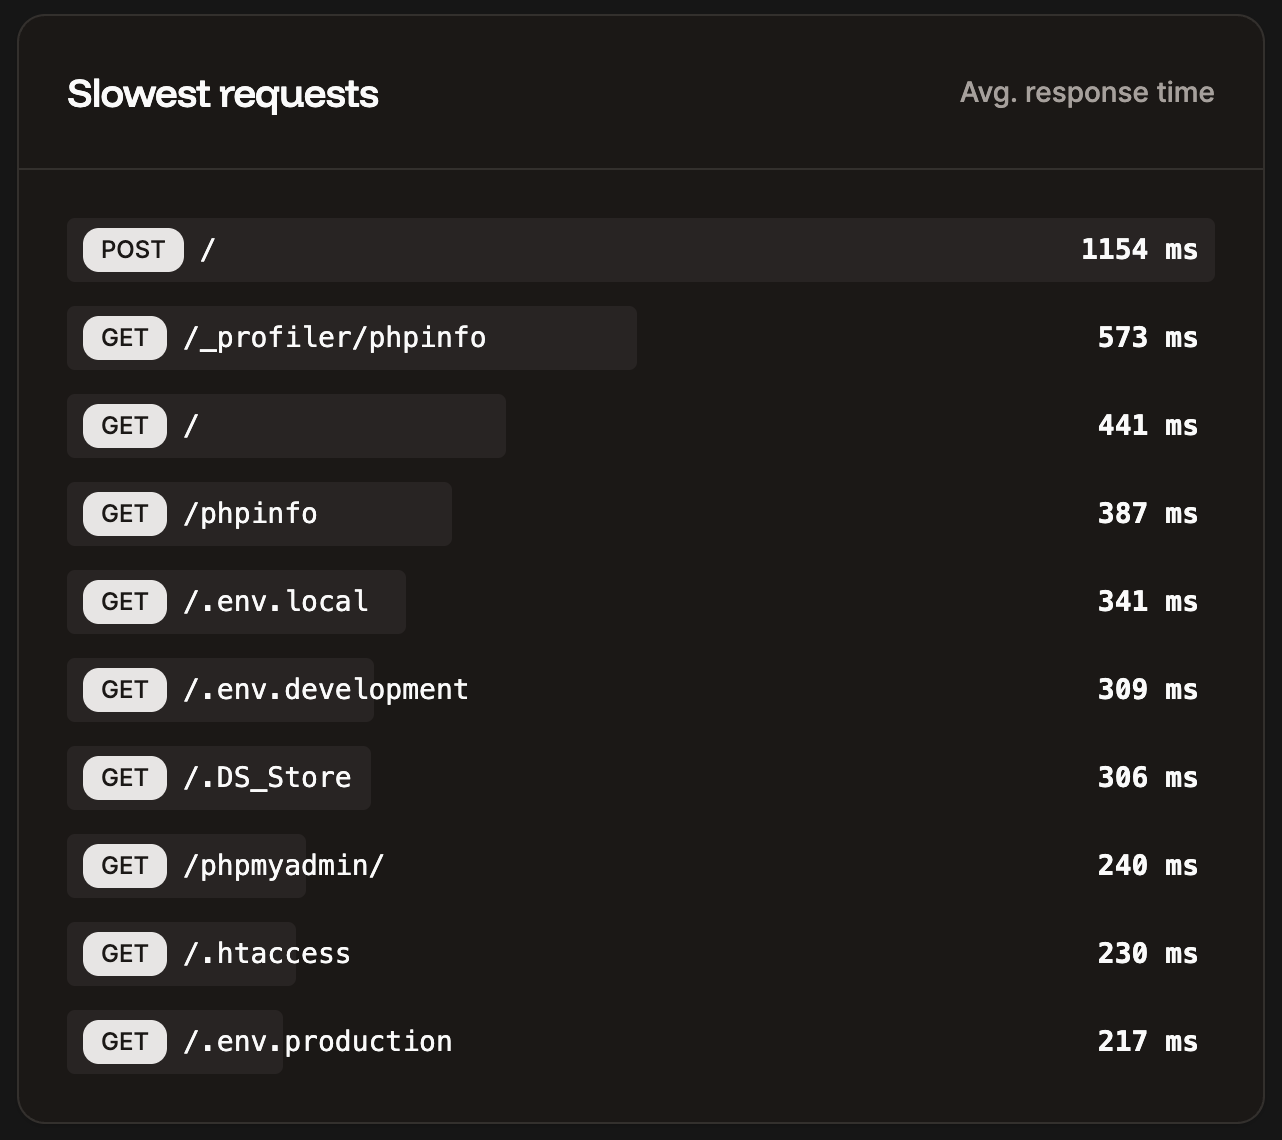
Slowest HTTP requests table.
Top pages
The Top pages table shows the top 10 most requested paths by the number of views for your site.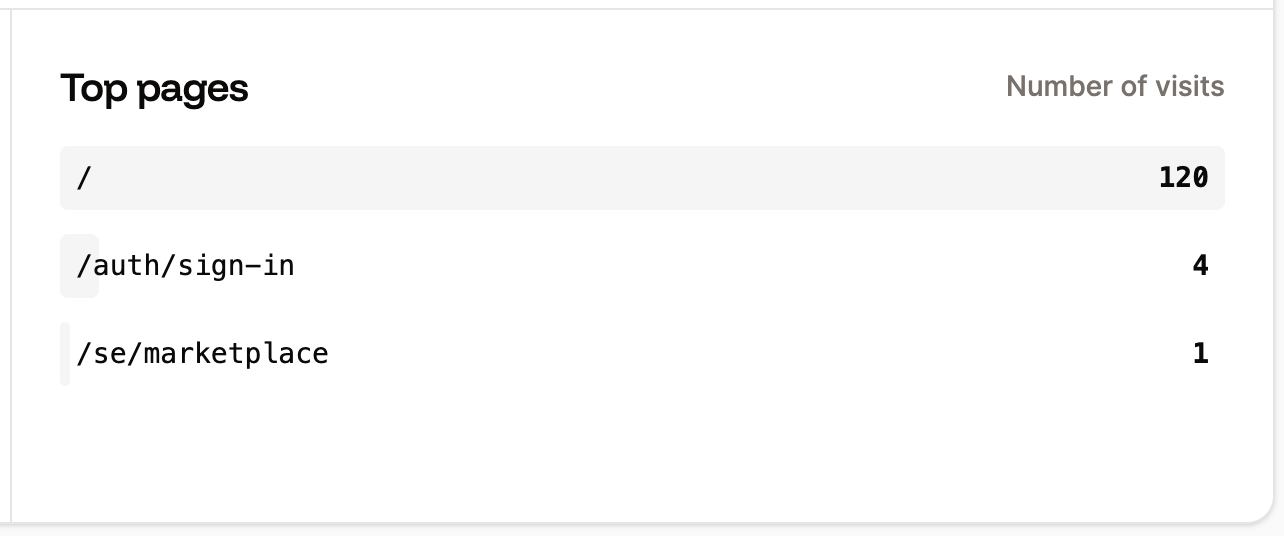
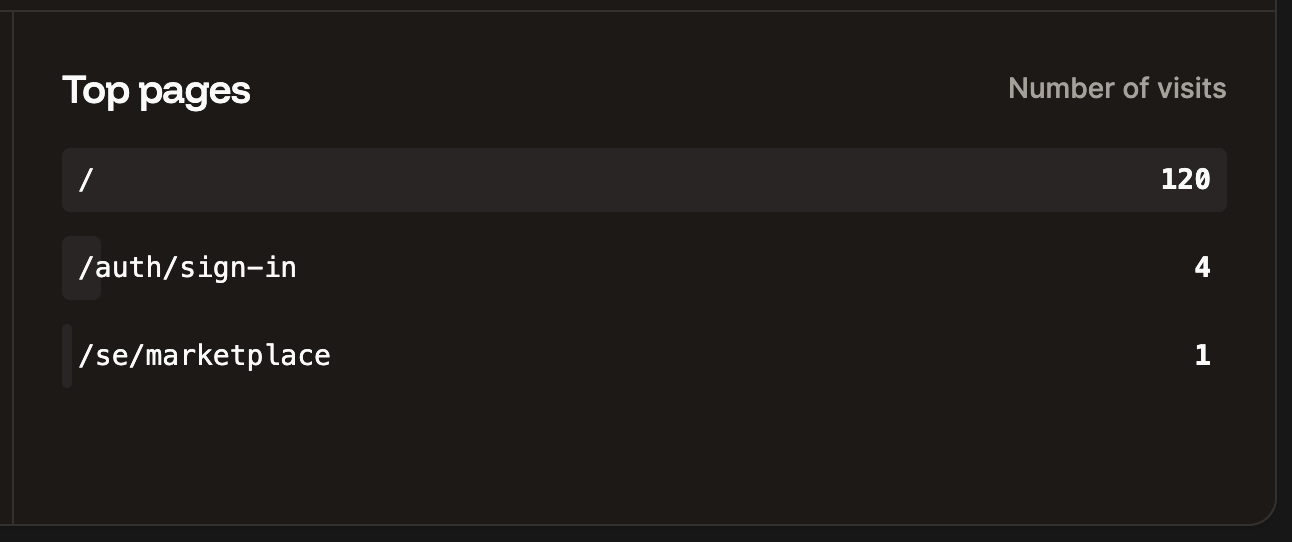
Top paths requests table.