
Log types
Write logs to
stdout and stderr, not to files: lines written to a file inside the instance don’t appear here.
Lines reach the dashboard a short time after they’re written; it can take up to 2 minutes.
Read logs
1
Open the Logs tab
In the sidebar, click Applications, then click the application. Click the Logs tab.
2
Pick the log type
In the filters on the left, choose Runtime logs or Access logs.
3
Narrow it down
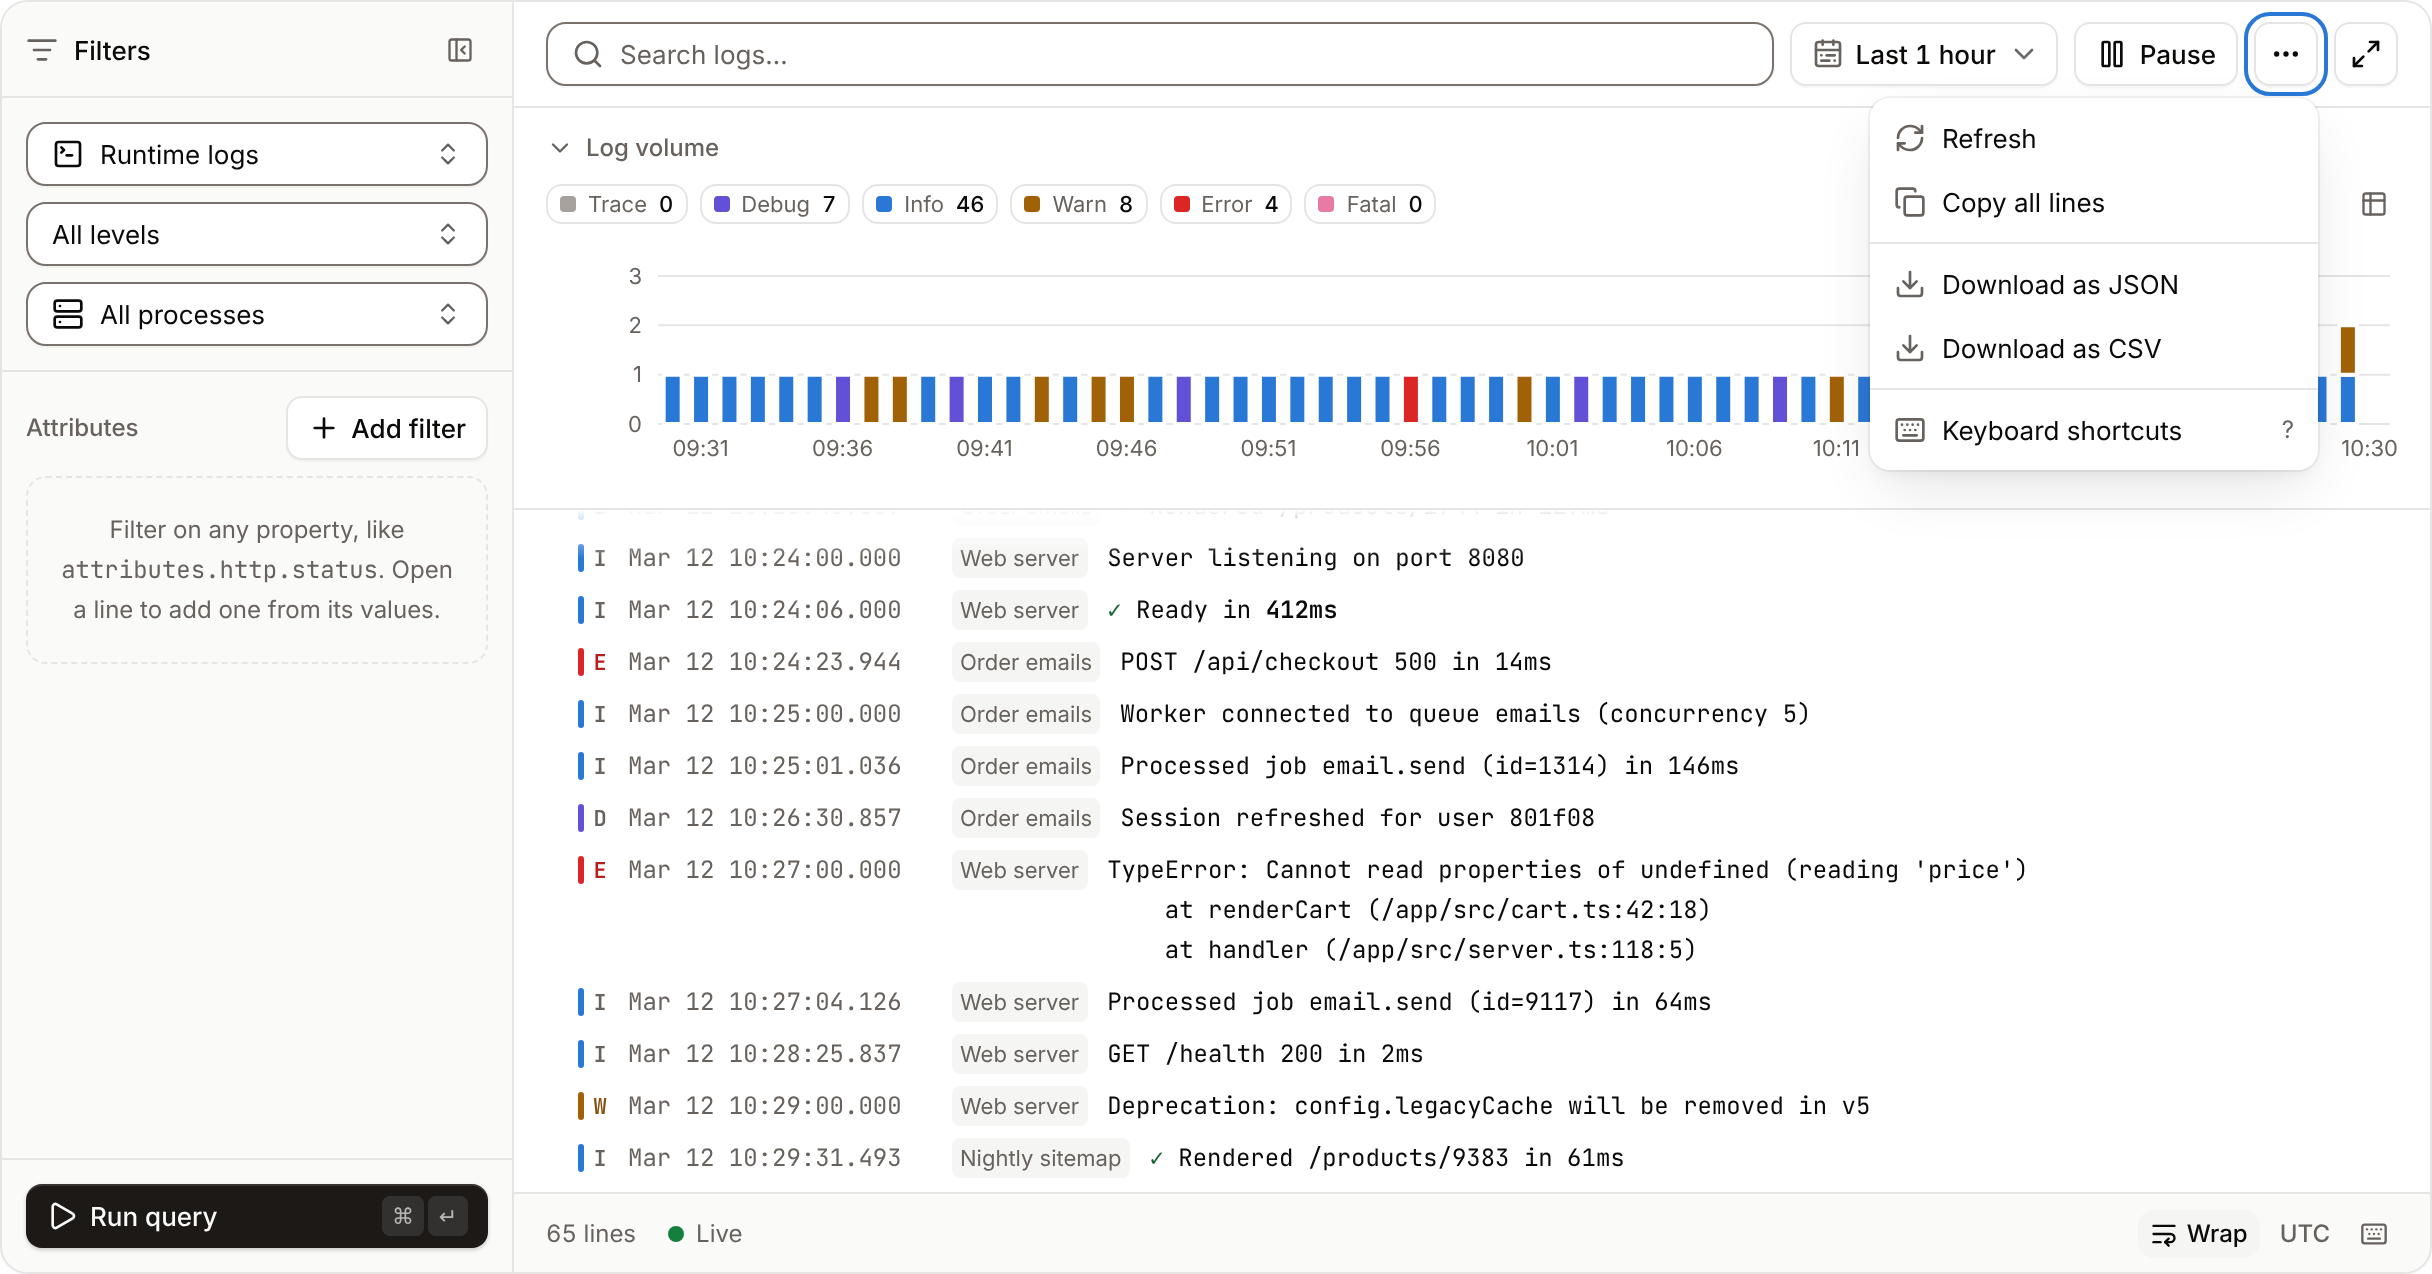
For runtime logs, pick a Level and a Process, or keep All levels and All processes. Type in Search logs… to show only lines that contain the text, and pick a time range.
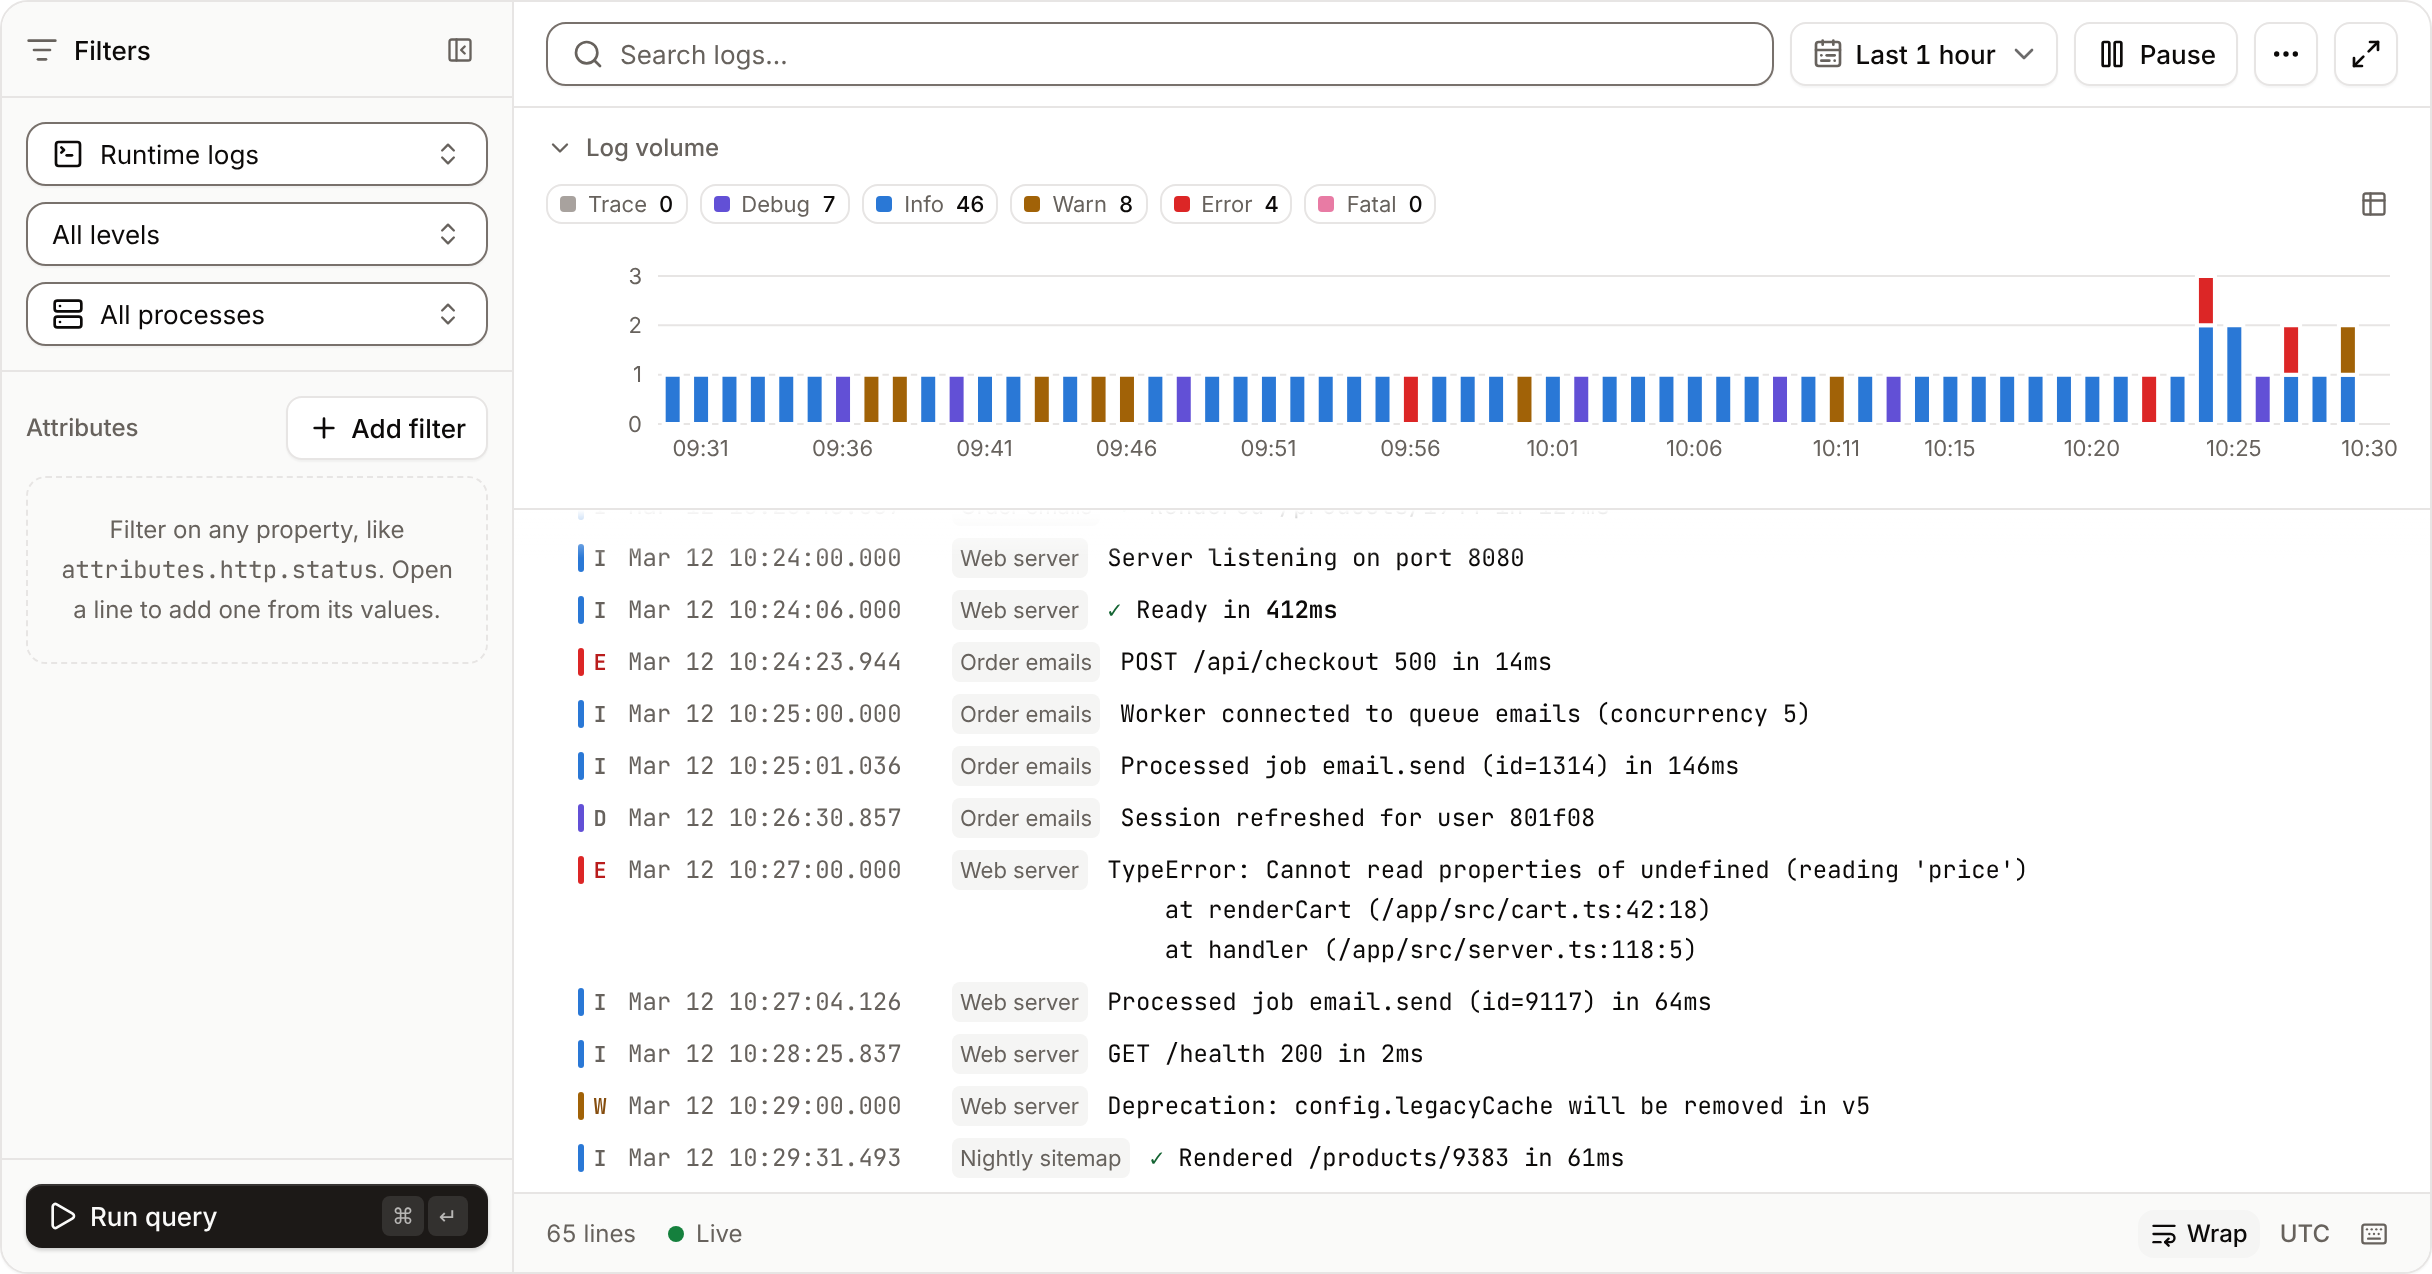
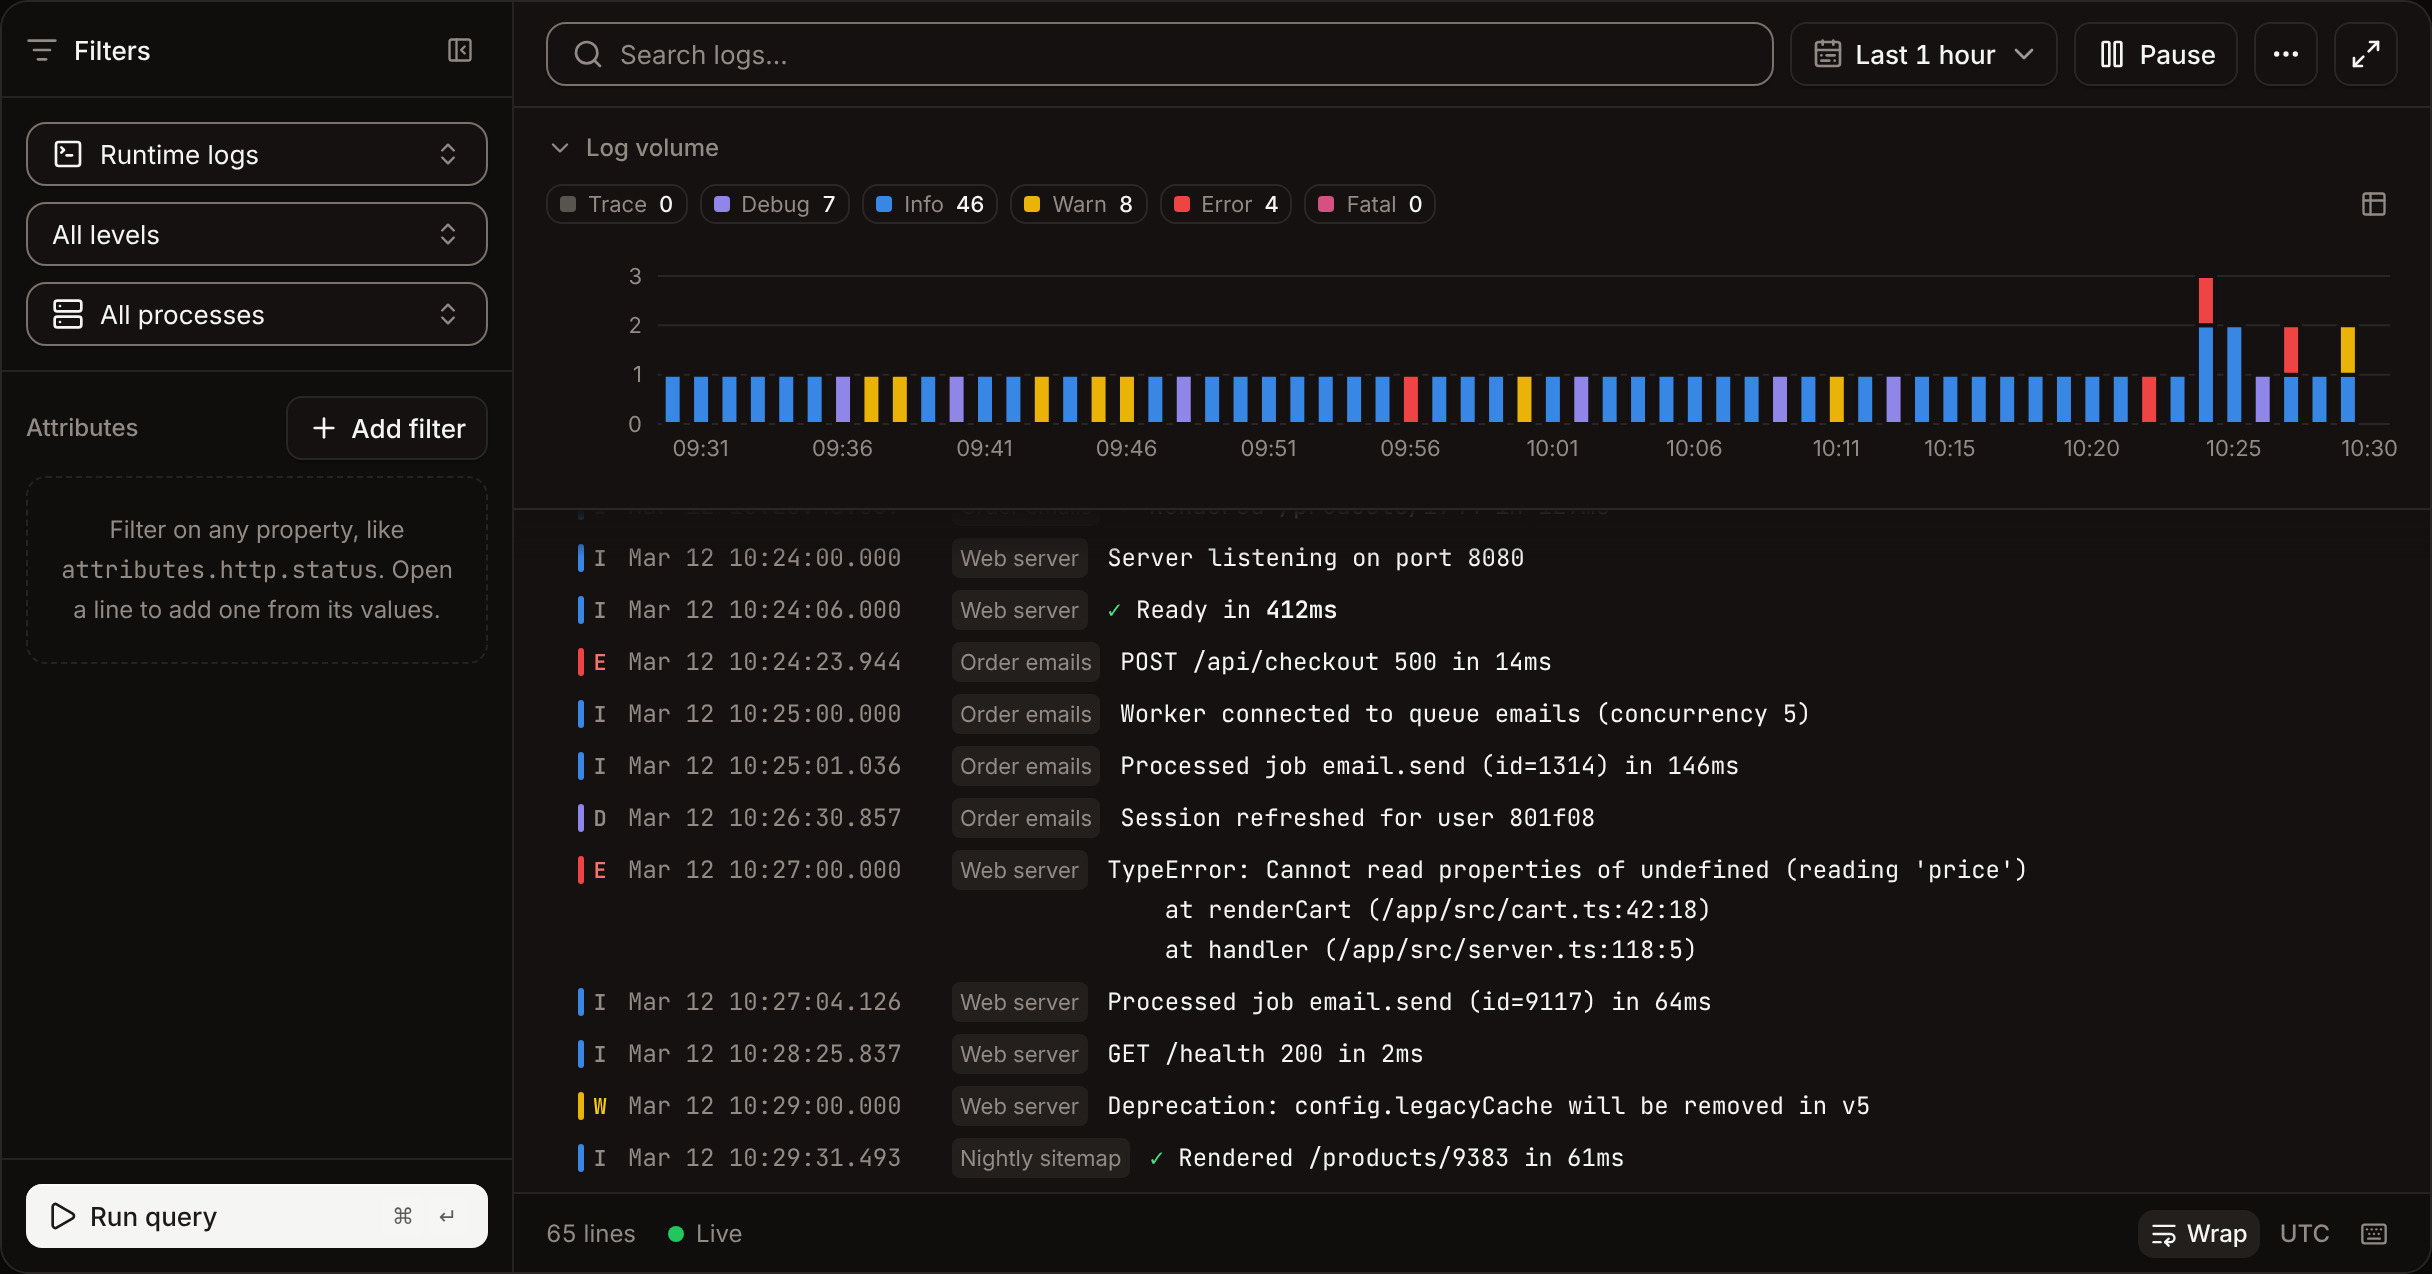
2xx to 5xx) for access logs. When lines from more than one process are on screen, each line shows its process’s name.
The levels are Trace, Debug, Info, Warn, Error and Fatal.
To see one process’s logs from the application’s Overview tab, click Logs on the process: the Logs tab opens filtered to it.
Pick a time range
The time range picker offers Last 1 hour (the default), Last 6 hours, Last 12 hours, Last 1 day, Last 2 days, Last 4 days, Last 7 days, Last 14 days and Last 30 days. For a custom range, pick a start and an end date and time within the last 60 days.Follow logs live
With a preset range (“Last …”), new lines appear as they’re written. Click Pause to stop the stream while you read, and Resume to continue. The stream pauses by itself after 200 updates, and when you scroll up, Jump to latest shows how many new lines arrived. The view keeps up to 20,000 lines; older ones drop off the top. A custom range that ended in the past shows history only. If the stream drops, the status bar says Live tail disconnected and offers to reconnect.Filter by attribute
Every line carries attributes, such as the request fields of an access log line. Open a line to see the keys it has. To filter on them:1
Add a filter
In Attributes, click Add filter.
2
Describe the condition
Enter the Key (
message, severity, or a path that starts with attributes. or tags.), pick an operator, and enter the Value.3
Run the query
Click Run query, or press Cmd+Enter (Ctrl+Enter on Windows and Linux).
You can also filter from a line: open it, then use the filter or exclude buttons next to any attribute. Open a line by clicking it to see all its attributes, copy them with Copy JSON, or show the 1, 5 or 10 minutes Around this line.
Copy and download logs
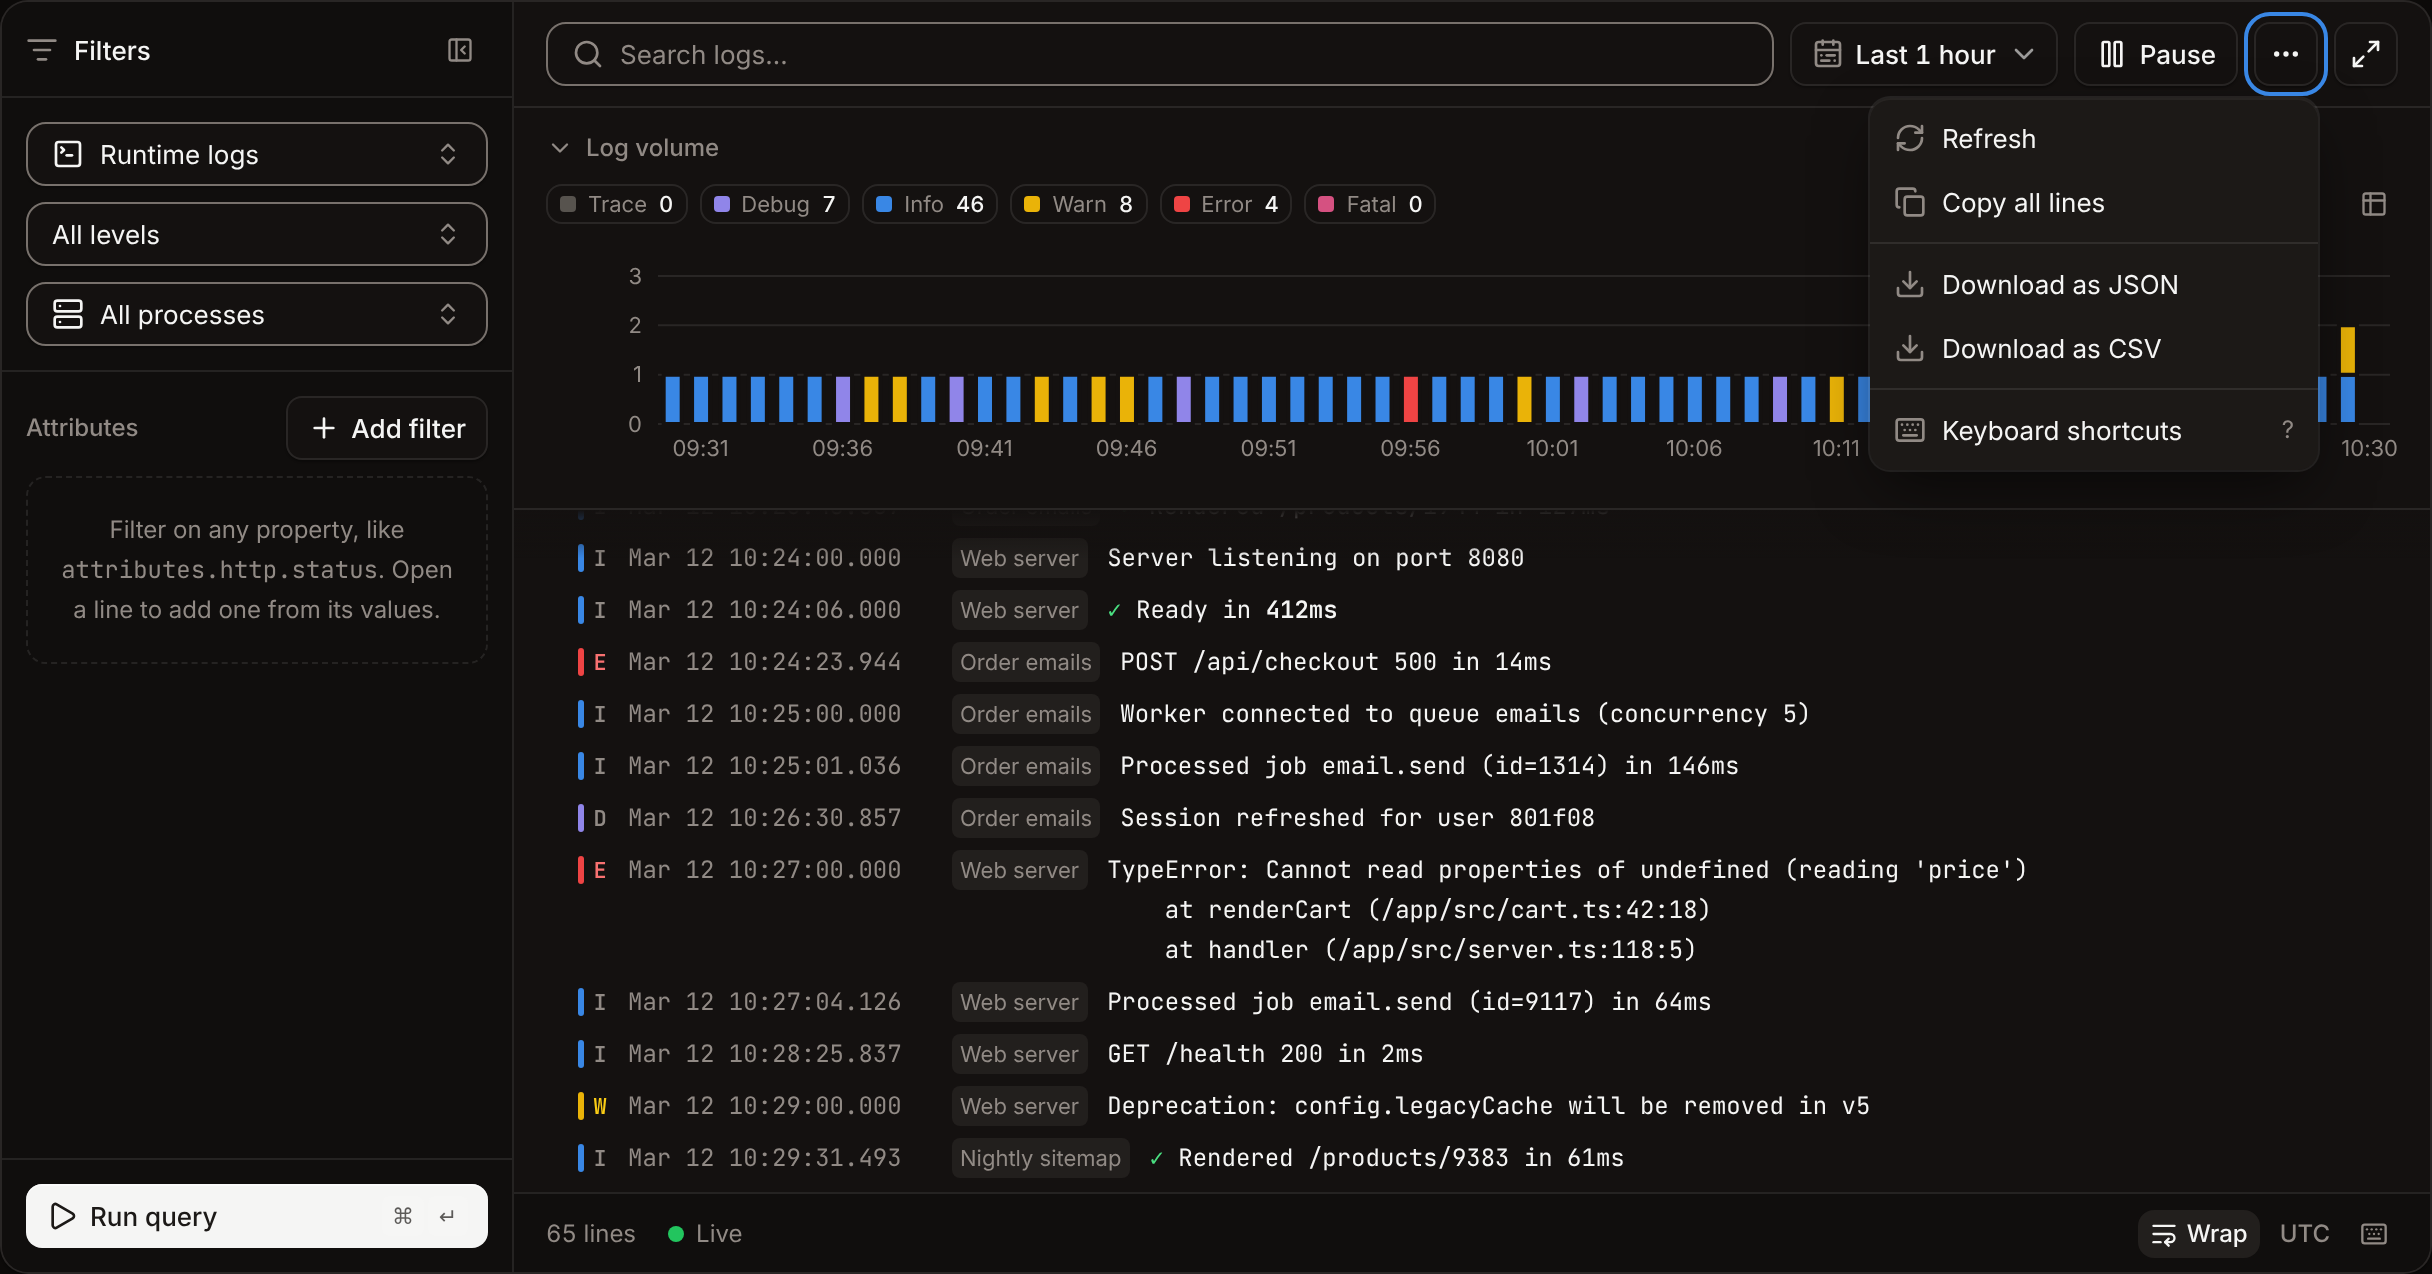
Click ⋯ (Log actions) above the lines:
Downloads contain the lines that match the current log type, filters, search and time range, up to the 10,000 most recent.